USGS is developing new and innovative ways to map the world around us.

Interactive Aquifer Maps
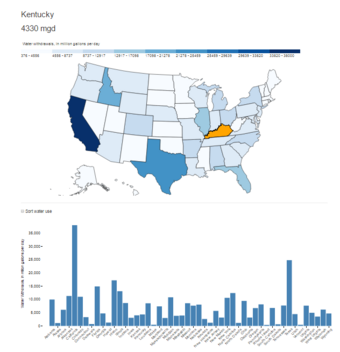
Two scientists developed a web-based storyboard to highlight the results of the USGS Report, Hydrologic Budget and Conditions of Permian, Pennsylvanian, and Mississippian Aquifers in the Appalachian Plateaus Physiographic Province. This storyboard has also been used to show maps, and corresponding data, for the Soil Water Balance (SWB) model. The map and storyboard were built using D3.js. An example map and chart are available on Github.
Below are partners associated with this project.
USGS is developing new and innovative ways to map the world around us.

Interactive Aquifer Maps
Two scientists developed a web-based storyboard to highlight the results of the USGS Report, Hydrologic Budget and Conditions of Permian, Pennsylvanian, and Mississippian Aquifers in the Appalachian Plateaus Physiographic Province. This storyboard has also been used to show maps, and corresponding data, for the Soil Water Balance (SWB) model. The map and storyboard were built using D3.js. An example map and chart are available on Github.
Below are partners associated with this project.

