
Low-Flow Frequency and Flow Duration Statistics at Continuous-Record Gages in South Carolina
South Carolina State agencies use low-flow statistics for many applications, including determining waste-load allocations for point sources, development of total maximum daily loads (TMDLs) for streams, determining the quantity of water that can be safely withdrawn from a particular stream, and preparing the State Water Plan. This project will monitor the low-flow frequency and duration statistics at continuous-record stations in several basins in South Carolina. Low-flow frequency and duration statistics were determined at continuous-record stations throughout South Carolina and are available in a series of on-line reports.
INTRODUCTION
South Carolina State agencies, such as the South Carolina Department of Health and Environmental Control (SCDHEC) and the South Carolina Department of Natural Resources, currently use low-flow statistics for many applications, including determining waste-load allocations for point sources, development of total maximum daily loads (TMDLs) for streams, determining the quantity of water that can be safely withdrawn from a particular stream, and preparing the State Water Plan. In addition, low-flow statistics are useful for improving the general level of understanding of natural and regulated stream systems. The two most recent droughts in South Carolina, during 1998–2002 and 2006–2009, have heightened the awareness of the importance of having up-to-date statistics for making such critical decisions.
Table 1. South Carolina Department of Health and Environmental Control (SCDHEC) basins.
- Pee Dee
- Broad
- Saluda and Edisto
- Catawba-Wateree and Santee
- Savannah and Salkehatchie
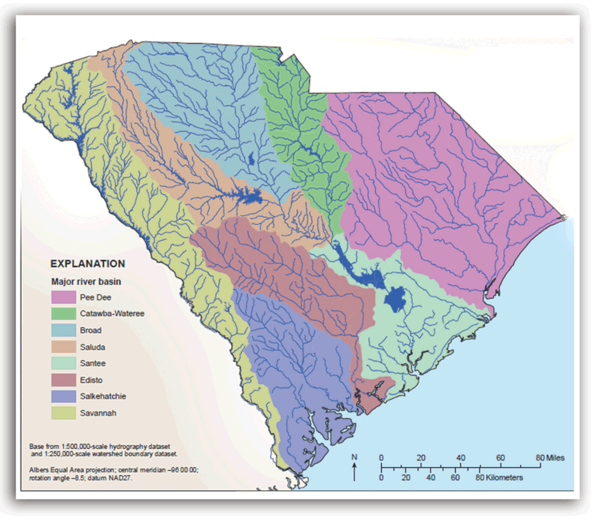
Prior to this investigation, low-flow statistics in South Carolina had not been updated in a systematic way since 1987. In 2008, the U.S. Geological Survey (USGS), in cooperation with the SCDHEC, initiated a study to update low-flow characteristics at continuous-record streamgaging stations operated by the USGS in South Carolina. This investigation coincides with the SCDHEC Watershed Water Quality Management Strategy (WWQMS) for monitoring and assessment of the eight major basins in South Carolina (fig. 1), which is done every 5 years (South Carolina Department of Health and Environmental Control, 2009). Consequently, several of the basins are grouped together to facilitate the 5-year rotation.
ANALYTICAL APPROACH
The low-flow frequency and duration statistics are being analyzed at continuous-record (CR) stations based on four categories of stations:
1. Long-term stations (typically defined as 30 years or more of CR data);
2. Short-term stations (more than 10 years of record but less than 30);
3. Stations with more than 5 years of CR record but less than 10; and
4. Regulated stations.
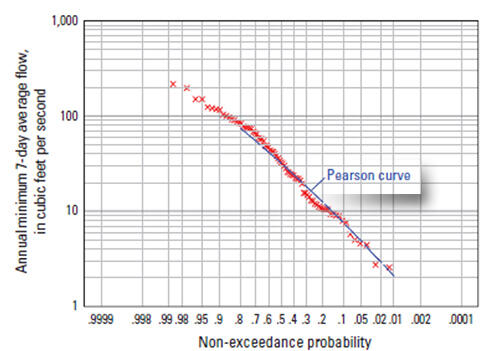
For the long-term stations, the low-flow frequency statistics are computed by fitting the logarithms of a series of annual minimum N-day average flows to a Pearson Type III distribution (fig. 2). For this investigation, the annual minimum 1-, 3-, 7-, 14-, 30-, 60-, and 90-day average flows are being analyzed. The low-flow statistics are presented as a set of non-exceedance probabilities or, alternatively, recurrence intervals along with their associated flows.
What is a 7Q10 Flow?
One of the most common low-flow statistics is the annual minimum 7-day average streamflow with a 10-year recurrence interval (7Q10). In terms of probability of occurrence, there is a 1/10 or 10-percent probability that the annual minimum 7-day average flow in any 1 year will be less than the estimated 7Q10 value.
Recurrence interval and non-exceedance probability are the mathematical inverses of one another. That is, a flow with a non-exceedance probability of 0.10 has a recurrence interval of 1 divided by 0.10 or 10 years. A 10-year recurrence interval does not imply that the value will have a non-exceedance every 10 years; it does indicate, however, that the average time between recurrences is equal to 10 years. Consequently, an observed interval between a non-exceedance of the 7Q10 may be as short as 1 year or may be considerably longer than 10 years.
RECORDS EXTENSIONS
If a long-term streamgage is available that is significantly correlated with a short-term streamgage, record-extension techniques can be used to extend or augment the records at the short-term gage to better reflect a longer period. Doing so allows for better consistency of streamflow statistics on streams that have multiple gaging stations of varying lengths of record. If a linear relation between the logarithms of the N-day flows at a short-term gage are determined to be significantly correlated with concurrent flows at a long-term, or index station, the Maintenance of Variance Extension, Type 1 (MOVE.1) method can be used to extend the record at the short-term gage (fig. 3a).
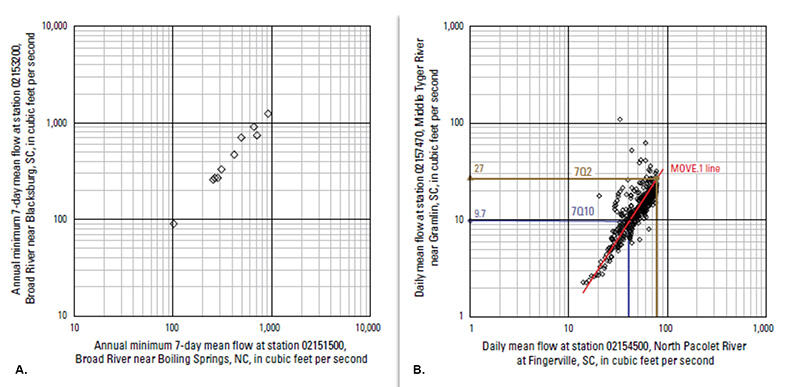
For the CR stations that have more than 5 years of CR data but less than 10 years of CR data, the MOVE.1 methods can be used to establish a relation between the concurrent daily mean flows that are less than or equal to the 90-percent flow duration (the lowest 10-percent of the flow record) at the index station. Another approach is to use the annual minimum N-day averalge flows in the MOVE.1 correlations. This analysis is similar to correlations at a partial-record station in which only the 7Q2 and 7Q10 flow statistics typically are generated (fig. 3b).
SUMMARY
Currently (2014), low-flow statistics have been published for the Pee Dee, Broad, Saluda and Edisto, and Catawba-Wateree and Santee River basins. Work on the Savannah and Salkehatchie River basins began in October 2014 and it is anticipated that information for those basins will be published by September 2016. Details and references for these investigations can be found by accessing the following USGS reports:
REFERENCES
Feaster, T.D., and Guimaraes, W.B., 2009, Low-flow frequency and flow duration of selected South Carolina streams in the Pee Dee River basin through March 2007: U.S. Geological Survey Open-File Report 2009-1171, 42 p., at https://pubs.usgs.gov/of/2009/1171/.
Guimaraes, W.B., and Feaster, T.D., 2010, Low-flow frequency and flow duration of selected South Carolina streams in the Broad River basin through March 2008: U.S. Geological Survey Open-File Report 2010-1305, 47 p., at https://pubs.usgs.gov/of/2010/1305/.
Feaster, T.D., and Guimaraes, W.B., 2012, Low-flow frequency and flow duration of selected South Carolina streams in the Saluda, Congaree, and Edisto River basins through March 2009: U.S. Geological Survey Open-File Report 2012–1253, 53 p., at https://pubs.usgs.gov/of/2012/1253/.
Feaster, T.D., and Guimaraes, W.B., 2014, Low-flow frequency and flow duration of selected South Carolina streams in the Catawba-Wateree and Santee River Basins through March 2012: U.S. Geological Survey Open-File Report 2014–1113, 34 p., at https://pubs.usgs.gov/of/2014/1113/.
Created: December 29, 2016
South Carolina State agencies use low-flow statistics for many applications, including determining waste-load allocations for point sources, development of total maximum daily loads (TMDLs) for streams, determining the quantity of water that can be safely withdrawn from a particular stream, and preparing the State Water Plan. This project will monitor the low-flow frequency and duration statistics at continuous-record stations in several basins in South Carolina. Low-flow frequency and duration statistics were determined at continuous-record stations throughout South Carolina and are available in a series of on-line reports.
INTRODUCTION
South Carolina State agencies, such as the South Carolina Department of Health and Environmental Control (SCDHEC) and the South Carolina Department of Natural Resources, currently use low-flow statistics for many applications, including determining waste-load allocations for point sources, development of total maximum daily loads (TMDLs) for streams, determining the quantity of water that can be safely withdrawn from a particular stream, and preparing the State Water Plan. In addition, low-flow statistics are useful for improving the general level of understanding of natural and regulated stream systems. The two most recent droughts in South Carolina, during 1998–2002 and 2006–2009, have heightened the awareness of the importance of having up-to-date statistics for making such critical decisions.
Table 1. South Carolina Department of Health and Environmental Control (SCDHEC) basins.
- Pee Dee
- Broad
- Saluda and Edisto
- Catawba-Wateree and Santee
- Savannah and Salkehatchie
Prior to this investigation, low-flow statistics in South Carolina had not been updated in a systematic way since 1987. In 2008, the U.S. Geological Survey (USGS), in cooperation with the SCDHEC, initiated a study to update low-flow characteristics at continuous-record streamgaging stations operated by the USGS in South Carolina. This investigation coincides with the SCDHEC Watershed Water Quality Management Strategy (WWQMS) for monitoring and assessment of the eight major basins in South Carolina (fig. 1), which is done every 5 years (South Carolina Department of Health and Environmental Control, 2009). Consequently, several of the basins are grouped together to facilitate the 5-year rotation.
ANALYTICAL APPROACH
The low-flow frequency and duration statistics are being analyzed at continuous-record (CR) stations based on four categories of stations:
1. Long-term stations (typically defined as 30 years or more of CR data);
2. Short-term stations (more than 10 years of record but less than 30);
3. Stations with more than 5 years of CR record but less than 10; and
4. Regulated stations.
For the long-term stations, the low-flow frequency statistics are computed by fitting the logarithms of a series of annual minimum N-day average flows to a Pearson Type III distribution (fig. 2). For this investigation, the annual minimum 1-, 3-, 7-, 14-, 30-, 60-, and 90-day average flows are being analyzed. The low-flow statistics are presented as a set of non-exceedance probabilities or, alternatively, recurrence intervals along with their associated flows.
What is a 7Q10 Flow?
One of the most common low-flow statistics is the annual minimum 7-day average streamflow with a 10-year recurrence interval (7Q10). In terms of probability of occurrence, there is a 1/10 or 10-percent probability that the annual minimum 7-day average flow in any 1 year will be less than the estimated 7Q10 value.
Recurrence interval and non-exceedance probability are the mathematical inverses of one another. That is, a flow with a non-exceedance probability of 0.10 has a recurrence interval of 1 divided by 0.10 or 10 years. A 10-year recurrence interval does not imply that the value will have a non-exceedance every 10 years; it does indicate, however, that the average time between recurrences is equal to 10 years. Consequently, an observed interval between a non-exceedance of the 7Q10 may be as short as 1 year or may be considerably longer than 10 years.
RECORDS EXTENSIONS
If a long-term streamgage is available that is significantly correlated with a short-term streamgage, record-extension techniques can be used to extend or augment the records at the short-term gage to better reflect a longer period. Doing so allows for better consistency of streamflow statistics on streams that have multiple gaging stations of varying lengths of record. If a linear relation between the logarithms of the N-day flows at a short-term gage are determined to be significantly correlated with concurrent flows at a long-term, or index station, the Maintenance of Variance Extension, Type 1 (MOVE.1) method can be used to extend the record at the short-term gage (fig. 3a).
For the CR stations that have more than 5 years of CR data but less than 10 years of CR data, the MOVE.1 methods can be used to establish a relation between the concurrent daily mean flows that are less than or equal to the 90-percent flow duration (the lowest 10-percent of the flow record) at the index station. Another approach is to use the annual minimum N-day averalge flows in the MOVE.1 correlations. This analysis is similar to correlations at a partial-record station in which only the 7Q2 and 7Q10 flow statistics typically are generated (fig. 3b).
SUMMARY
Currently (2014), low-flow statistics have been published for the Pee Dee, Broad, Saluda and Edisto, and Catawba-Wateree and Santee River basins. Work on the Savannah and Salkehatchie River basins began in October 2014 and it is anticipated that information for those basins will be published by September 2016. Details and references for these investigations can be found by accessing the following USGS reports:
REFERENCES
Feaster, T.D., and Guimaraes, W.B., 2009, Low-flow frequency and flow duration of selected South Carolina streams in the Pee Dee River basin through March 2007: U.S. Geological Survey Open-File Report 2009-1171, 42 p., at https://pubs.usgs.gov/of/2009/1171/.
Guimaraes, W.B., and Feaster, T.D., 2010, Low-flow frequency and flow duration of selected South Carolina streams in the Broad River basin through March 2008: U.S. Geological Survey Open-File Report 2010-1305, 47 p., at https://pubs.usgs.gov/of/2010/1305/.
Feaster, T.D., and Guimaraes, W.B., 2012, Low-flow frequency and flow duration of selected South Carolina streams in the Saluda, Congaree, and Edisto River basins through March 2009: U.S. Geological Survey Open-File Report 2012–1253, 53 p., at https://pubs.usgs.gov/of/2012/1253/.
Feaster, T.D., and Guimaraes, W.B., 2014, Low-flow frequency and flow duration of selected South Carolina streams in the Catawba-Wateree and Santee River Basins through March 2012: U.S. Geological Survey Open-File Report 2014–1113, 34 p., at https://pubs.usgs.gov/of/2014/1113/.
Created: December 29, 2016