
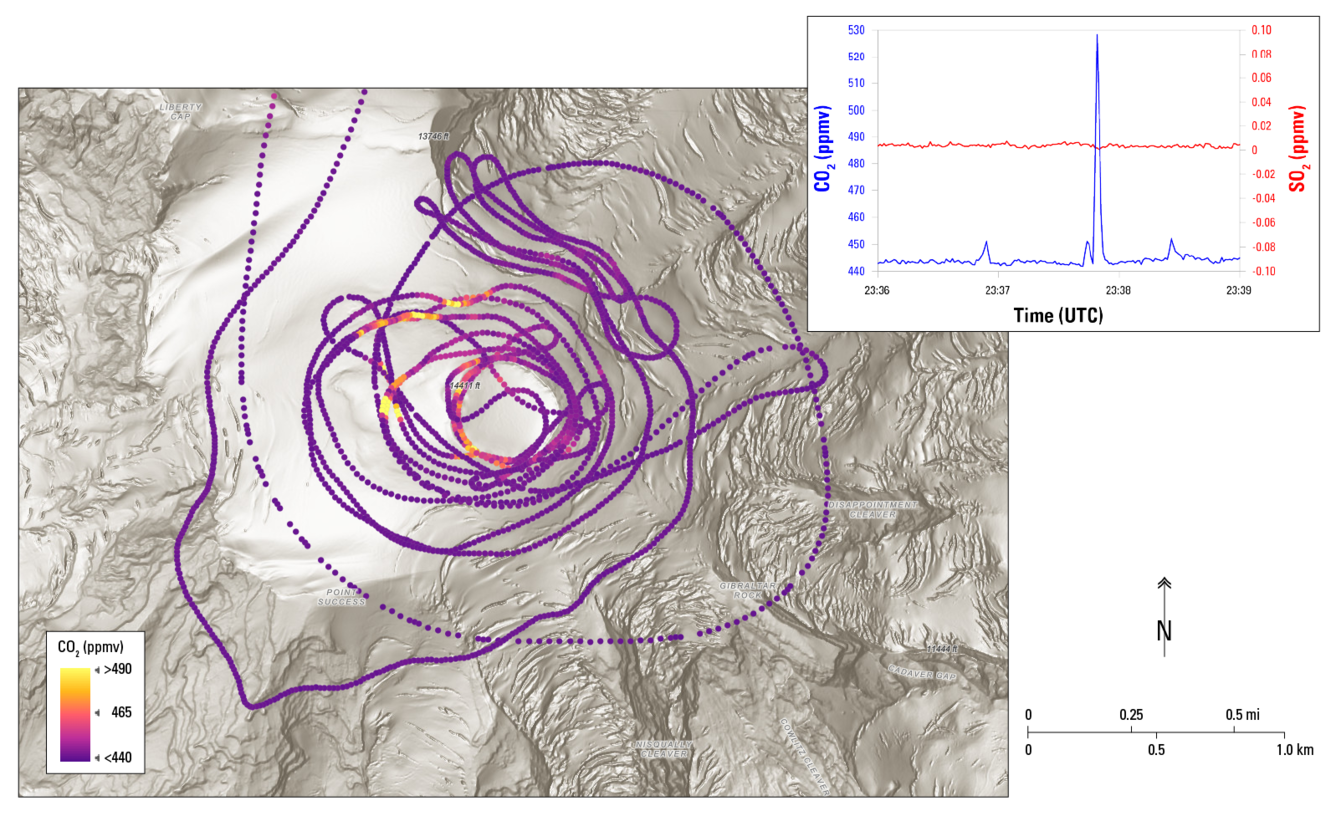
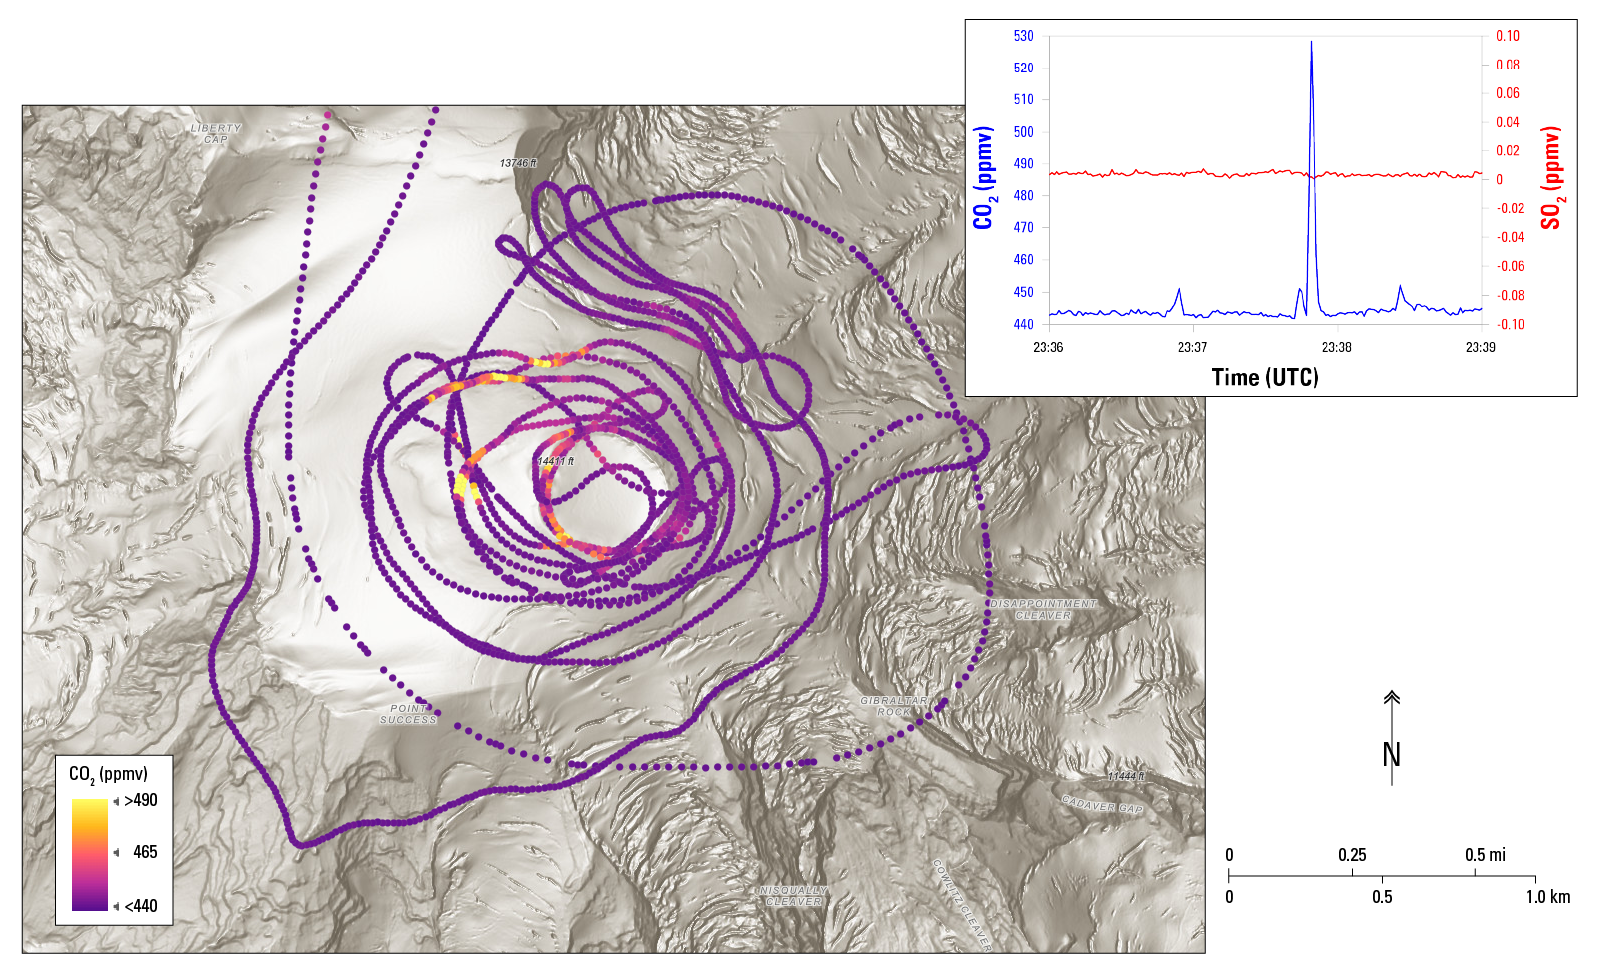
A shaded relief map of Mount Rainier with GPS track from the gas observation flight.
Detailed Description
A shaded relief map of Mount Rainier with GPS track from the gas observation flight. The colors correspond to CO2 levels in parts per million by volume (ppmv) that were measured during the flight. Yellow points indicate elevated CO2 levels, which were located near visibly degassing volcanic gas vents. The small inset plot shows example CO2 and SO2 data. Note that clear CO2 peaks (blue line, left axis) were observed as the aircraft passed over visibly degassing vents, but no corresponding SO2 was detected (red line, right axis).
Sources/Usage
Public Domain.