
Monitoring location pages and linear scale
Detailed Description
Did you ever wonder why most monitoring location pages default to the log scale?
At many streamgage sites, flow can fluctuate rapidly from day to day. The log scale helps show those peaks while still extracting more details at low flow.
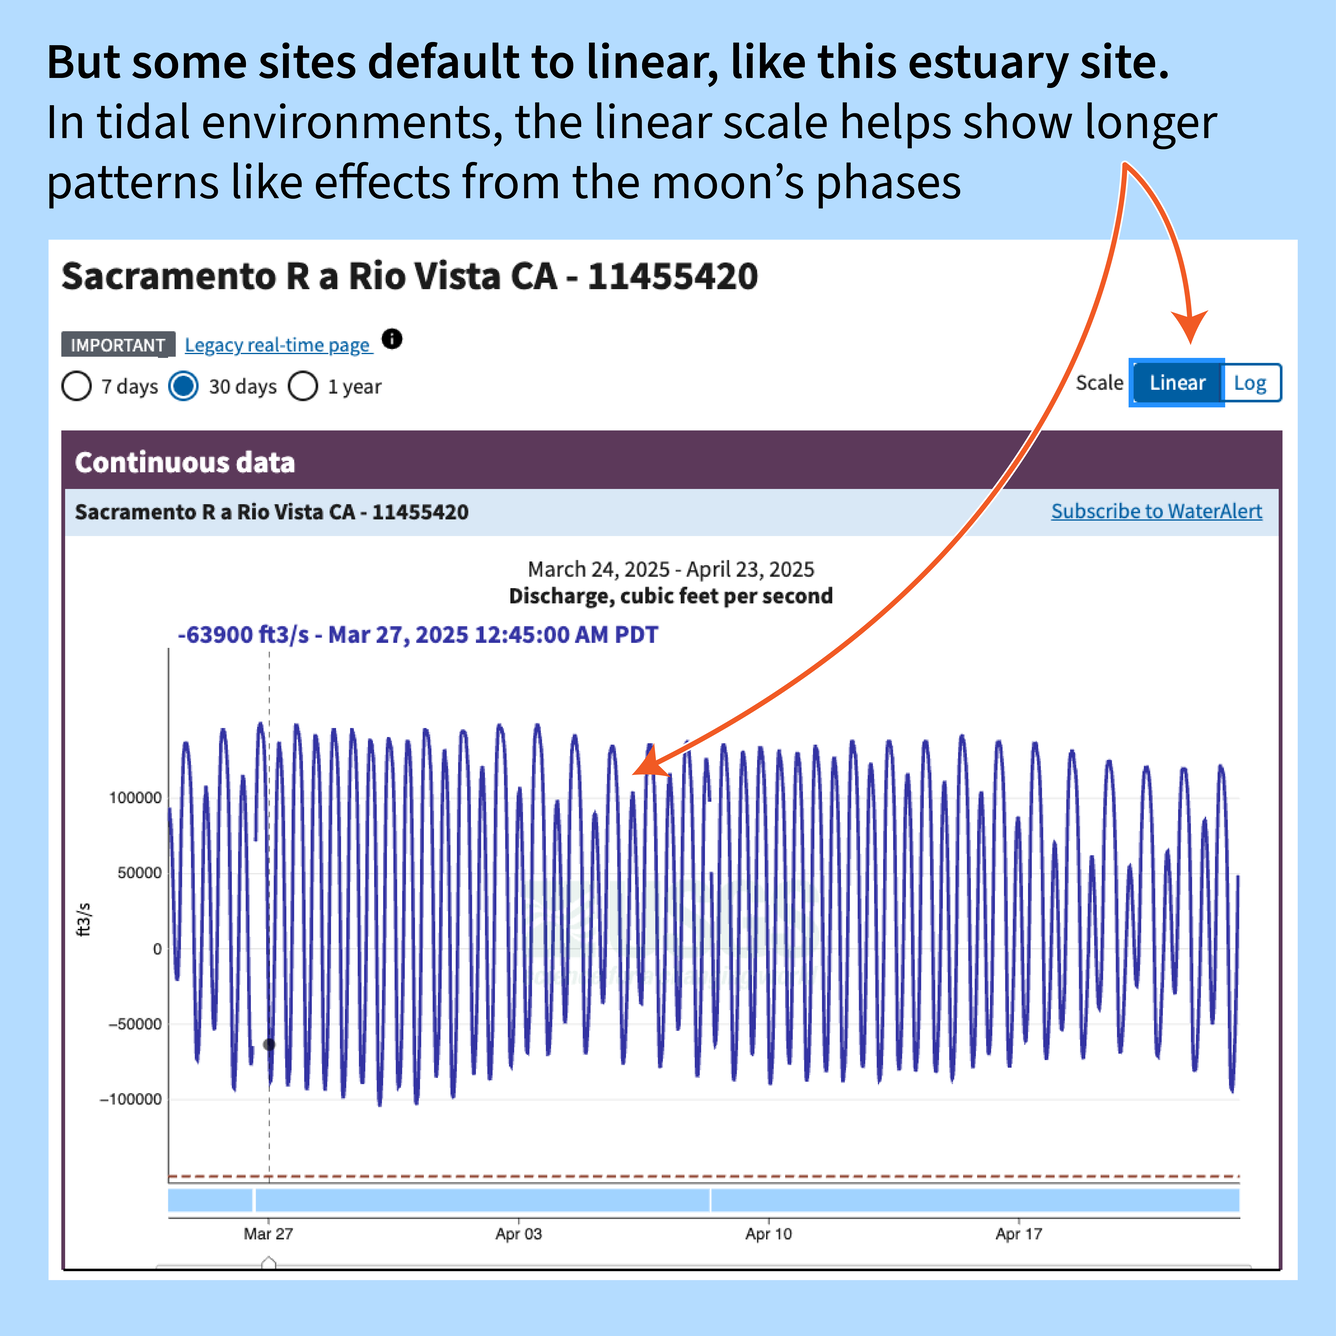
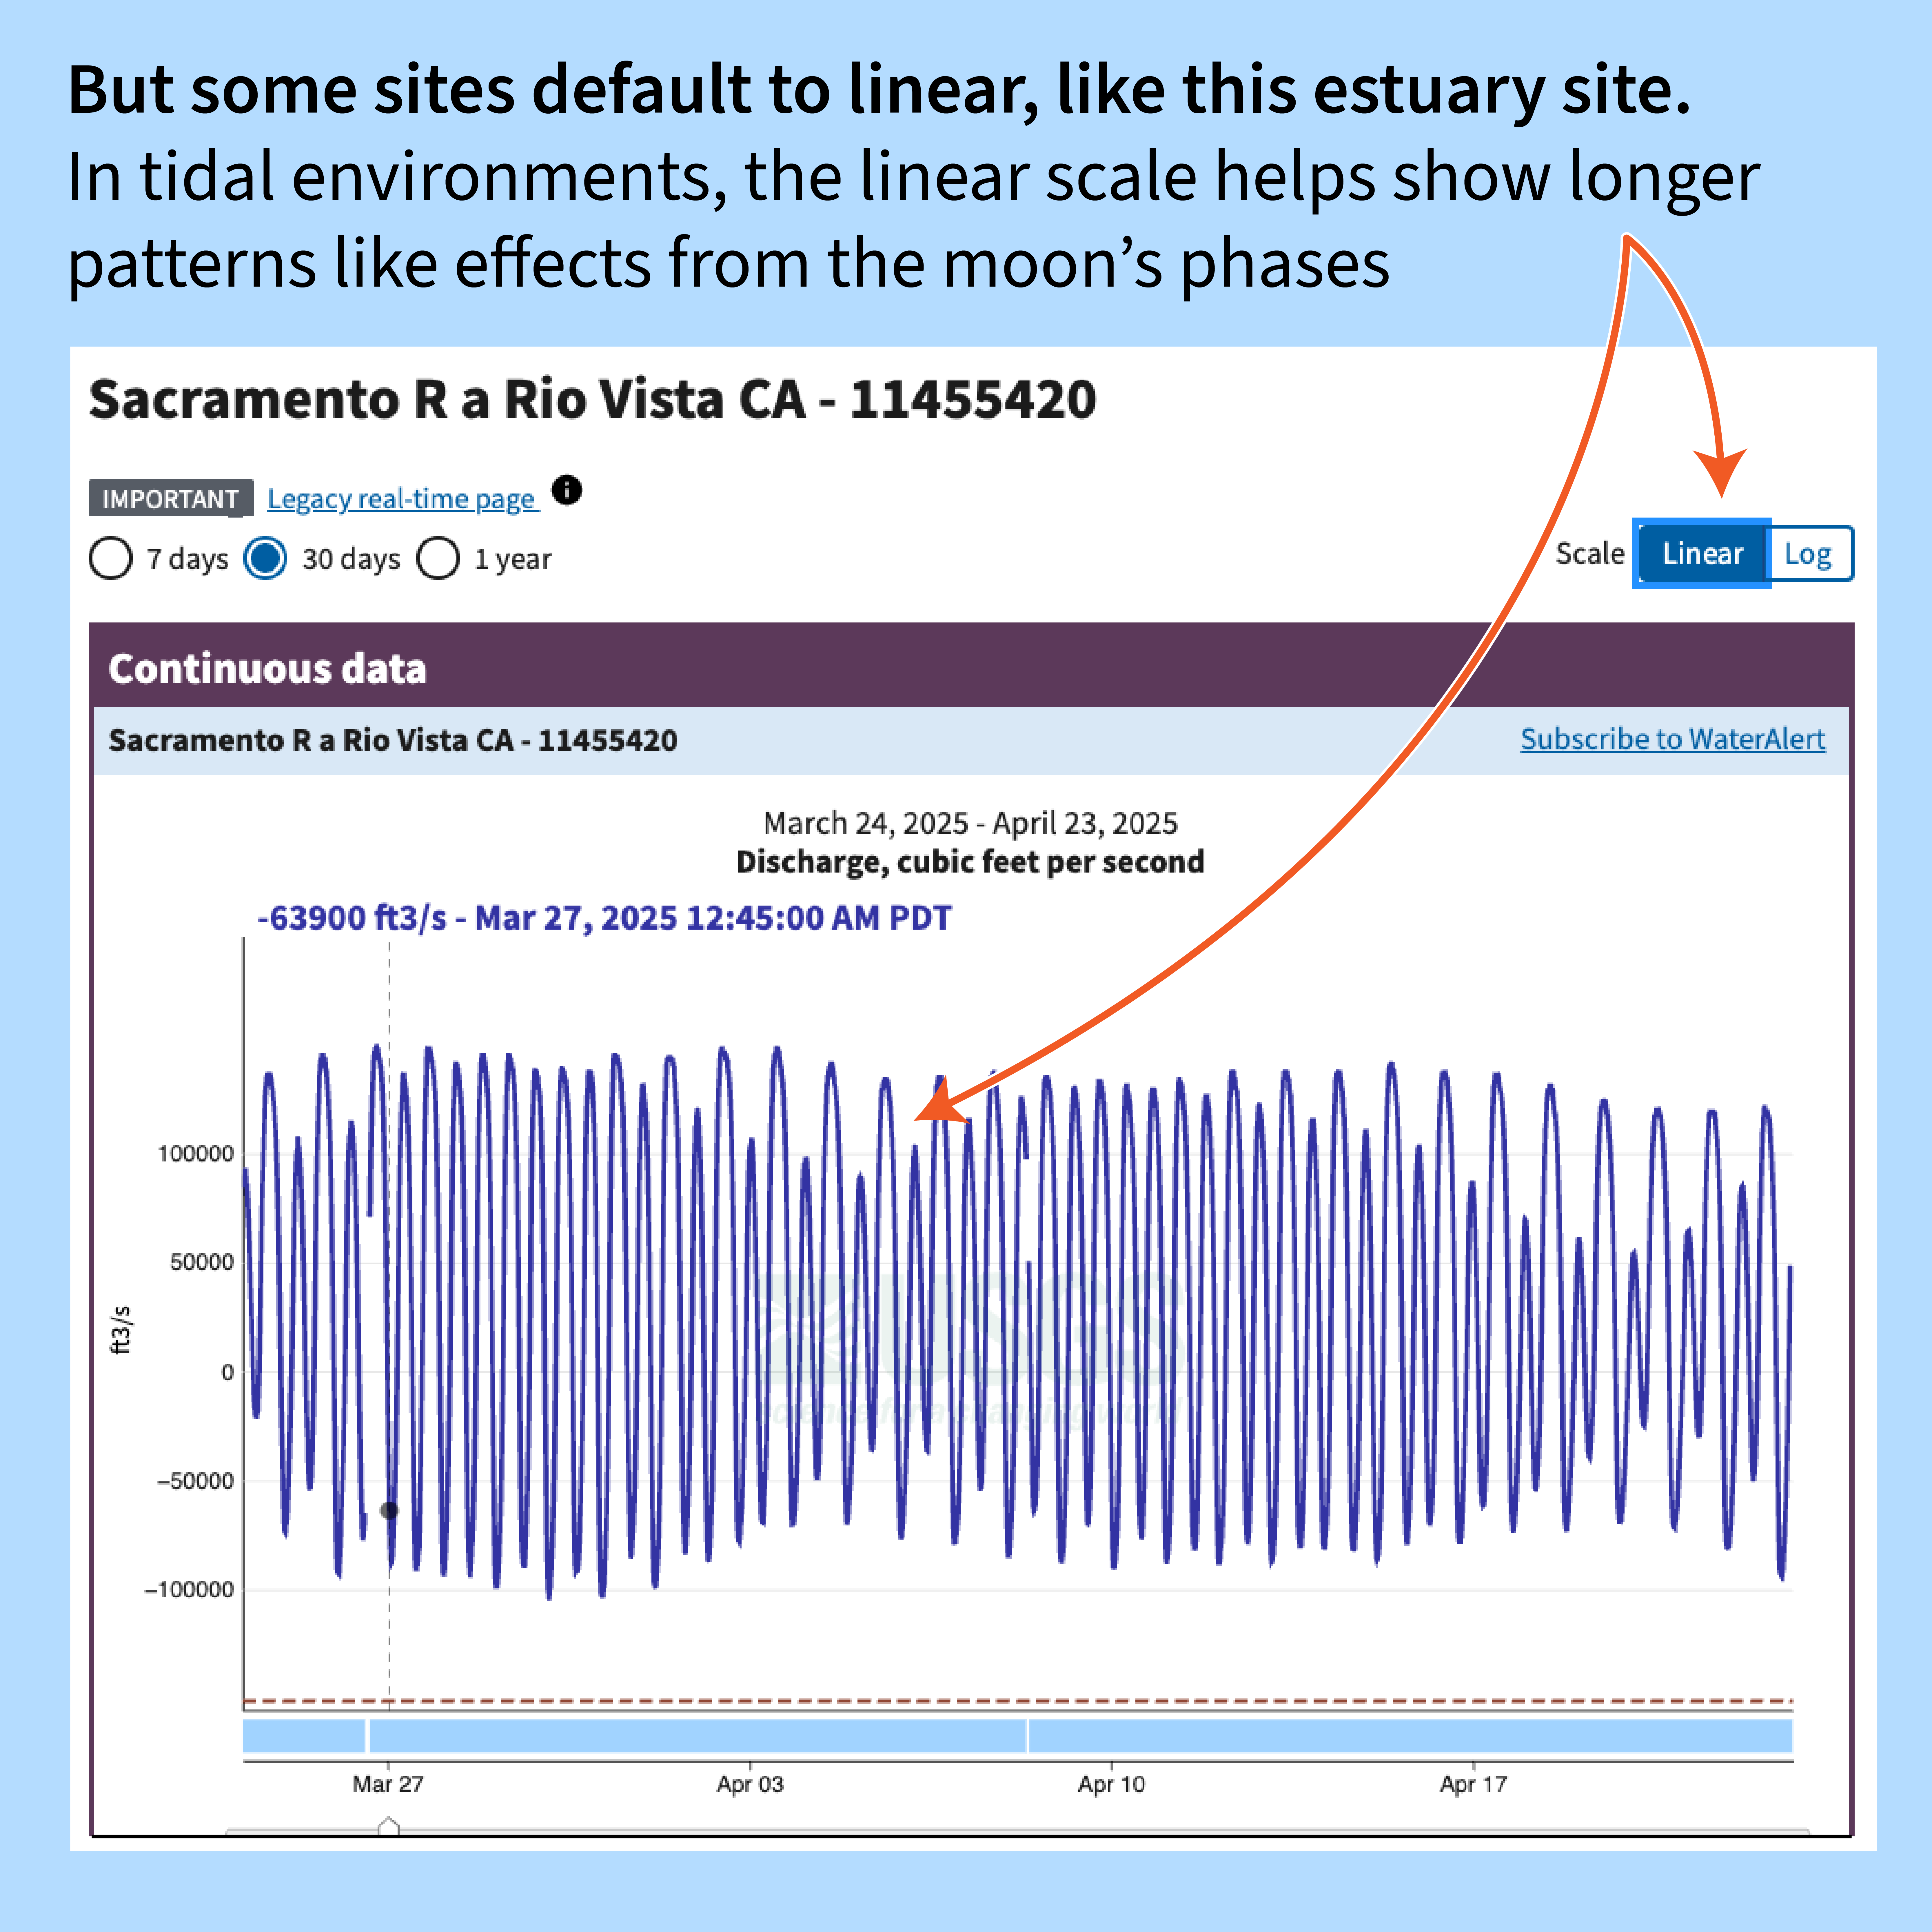
But in tidal environments, like estuaries, log scale doesn’t work as well because as the tide leaves, discharge cycles between positive and negative values. The log scale hides long-term patterns like the two-week cycle from the moon’s phases. These types of sites default to the linear scale.
Image shows a hydrograph (discharge over time) of a streamgage (Sacramento R a Rio Vista, CA) from March 24 to April 23, 2025. Arrows point to the linear-scale button and the general fluctuations that occur about every 2 weeks from the moon’s phases. The daily tide cycle shows how discharge is positive when the tide is in and negative when the tide is out.
Timeseries – Log Scale #30DayChartChallenge
Sources/Usage
Public Domain.