
The 2013–2014 Norris uplift and associated earthquakes
Detailed Description
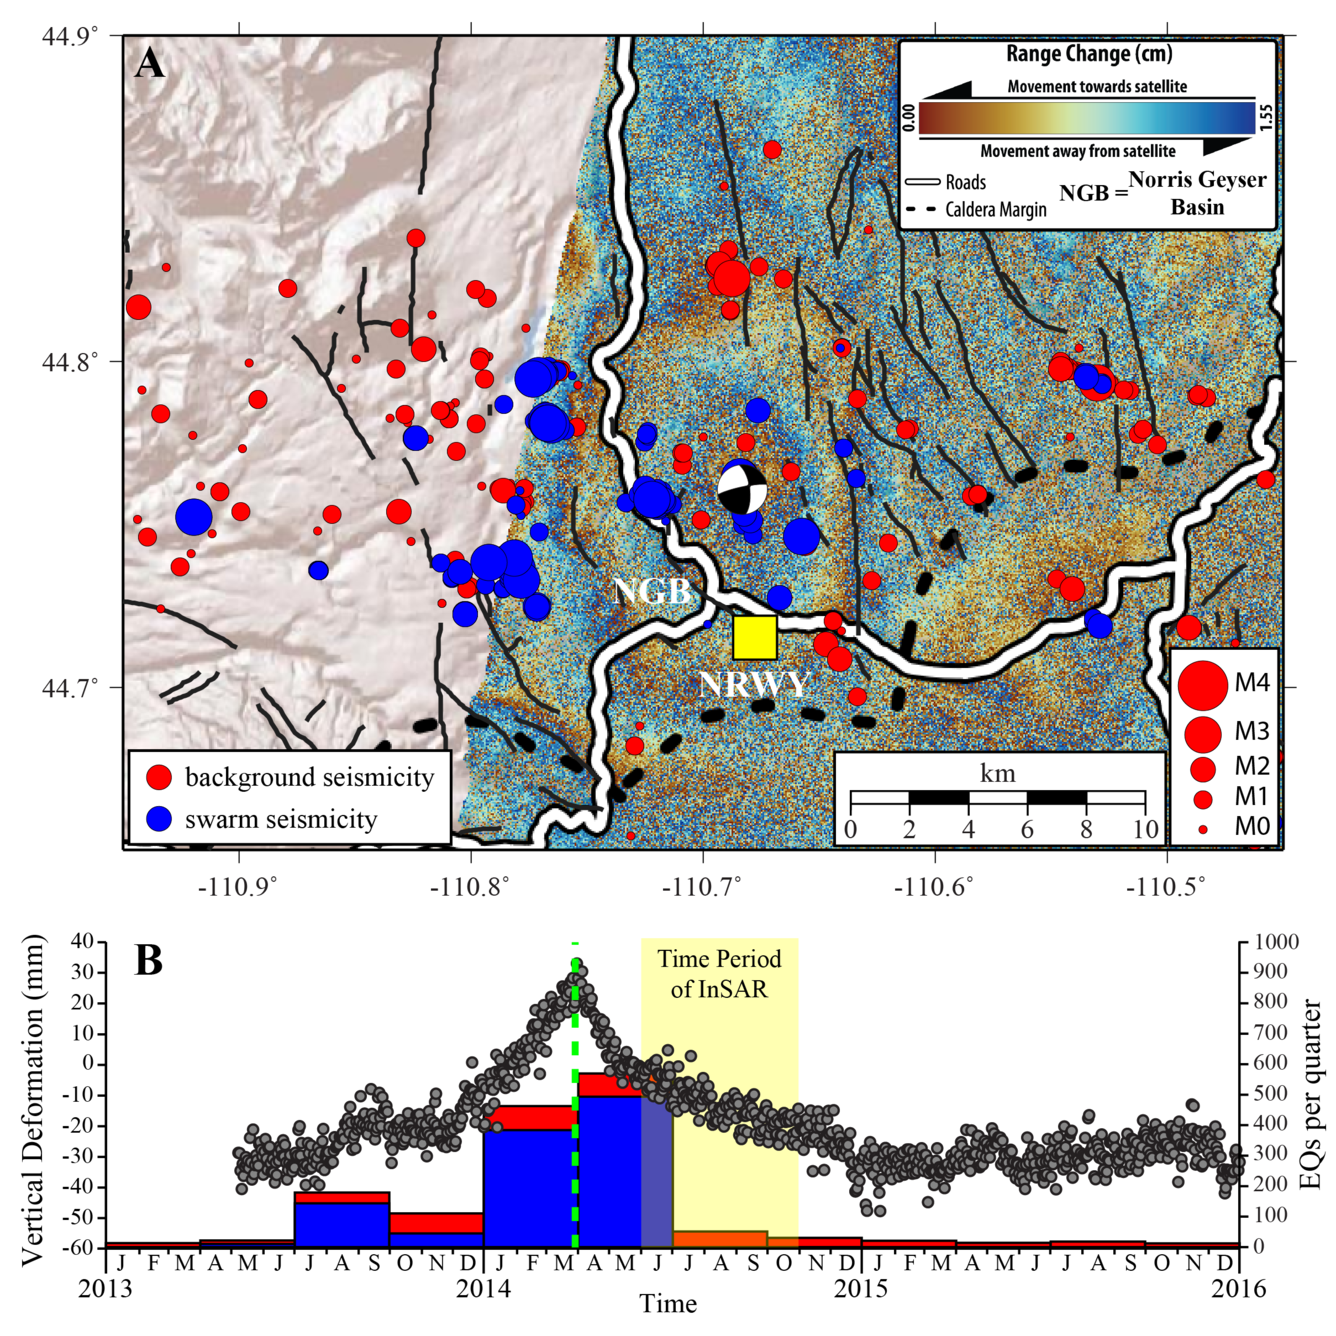
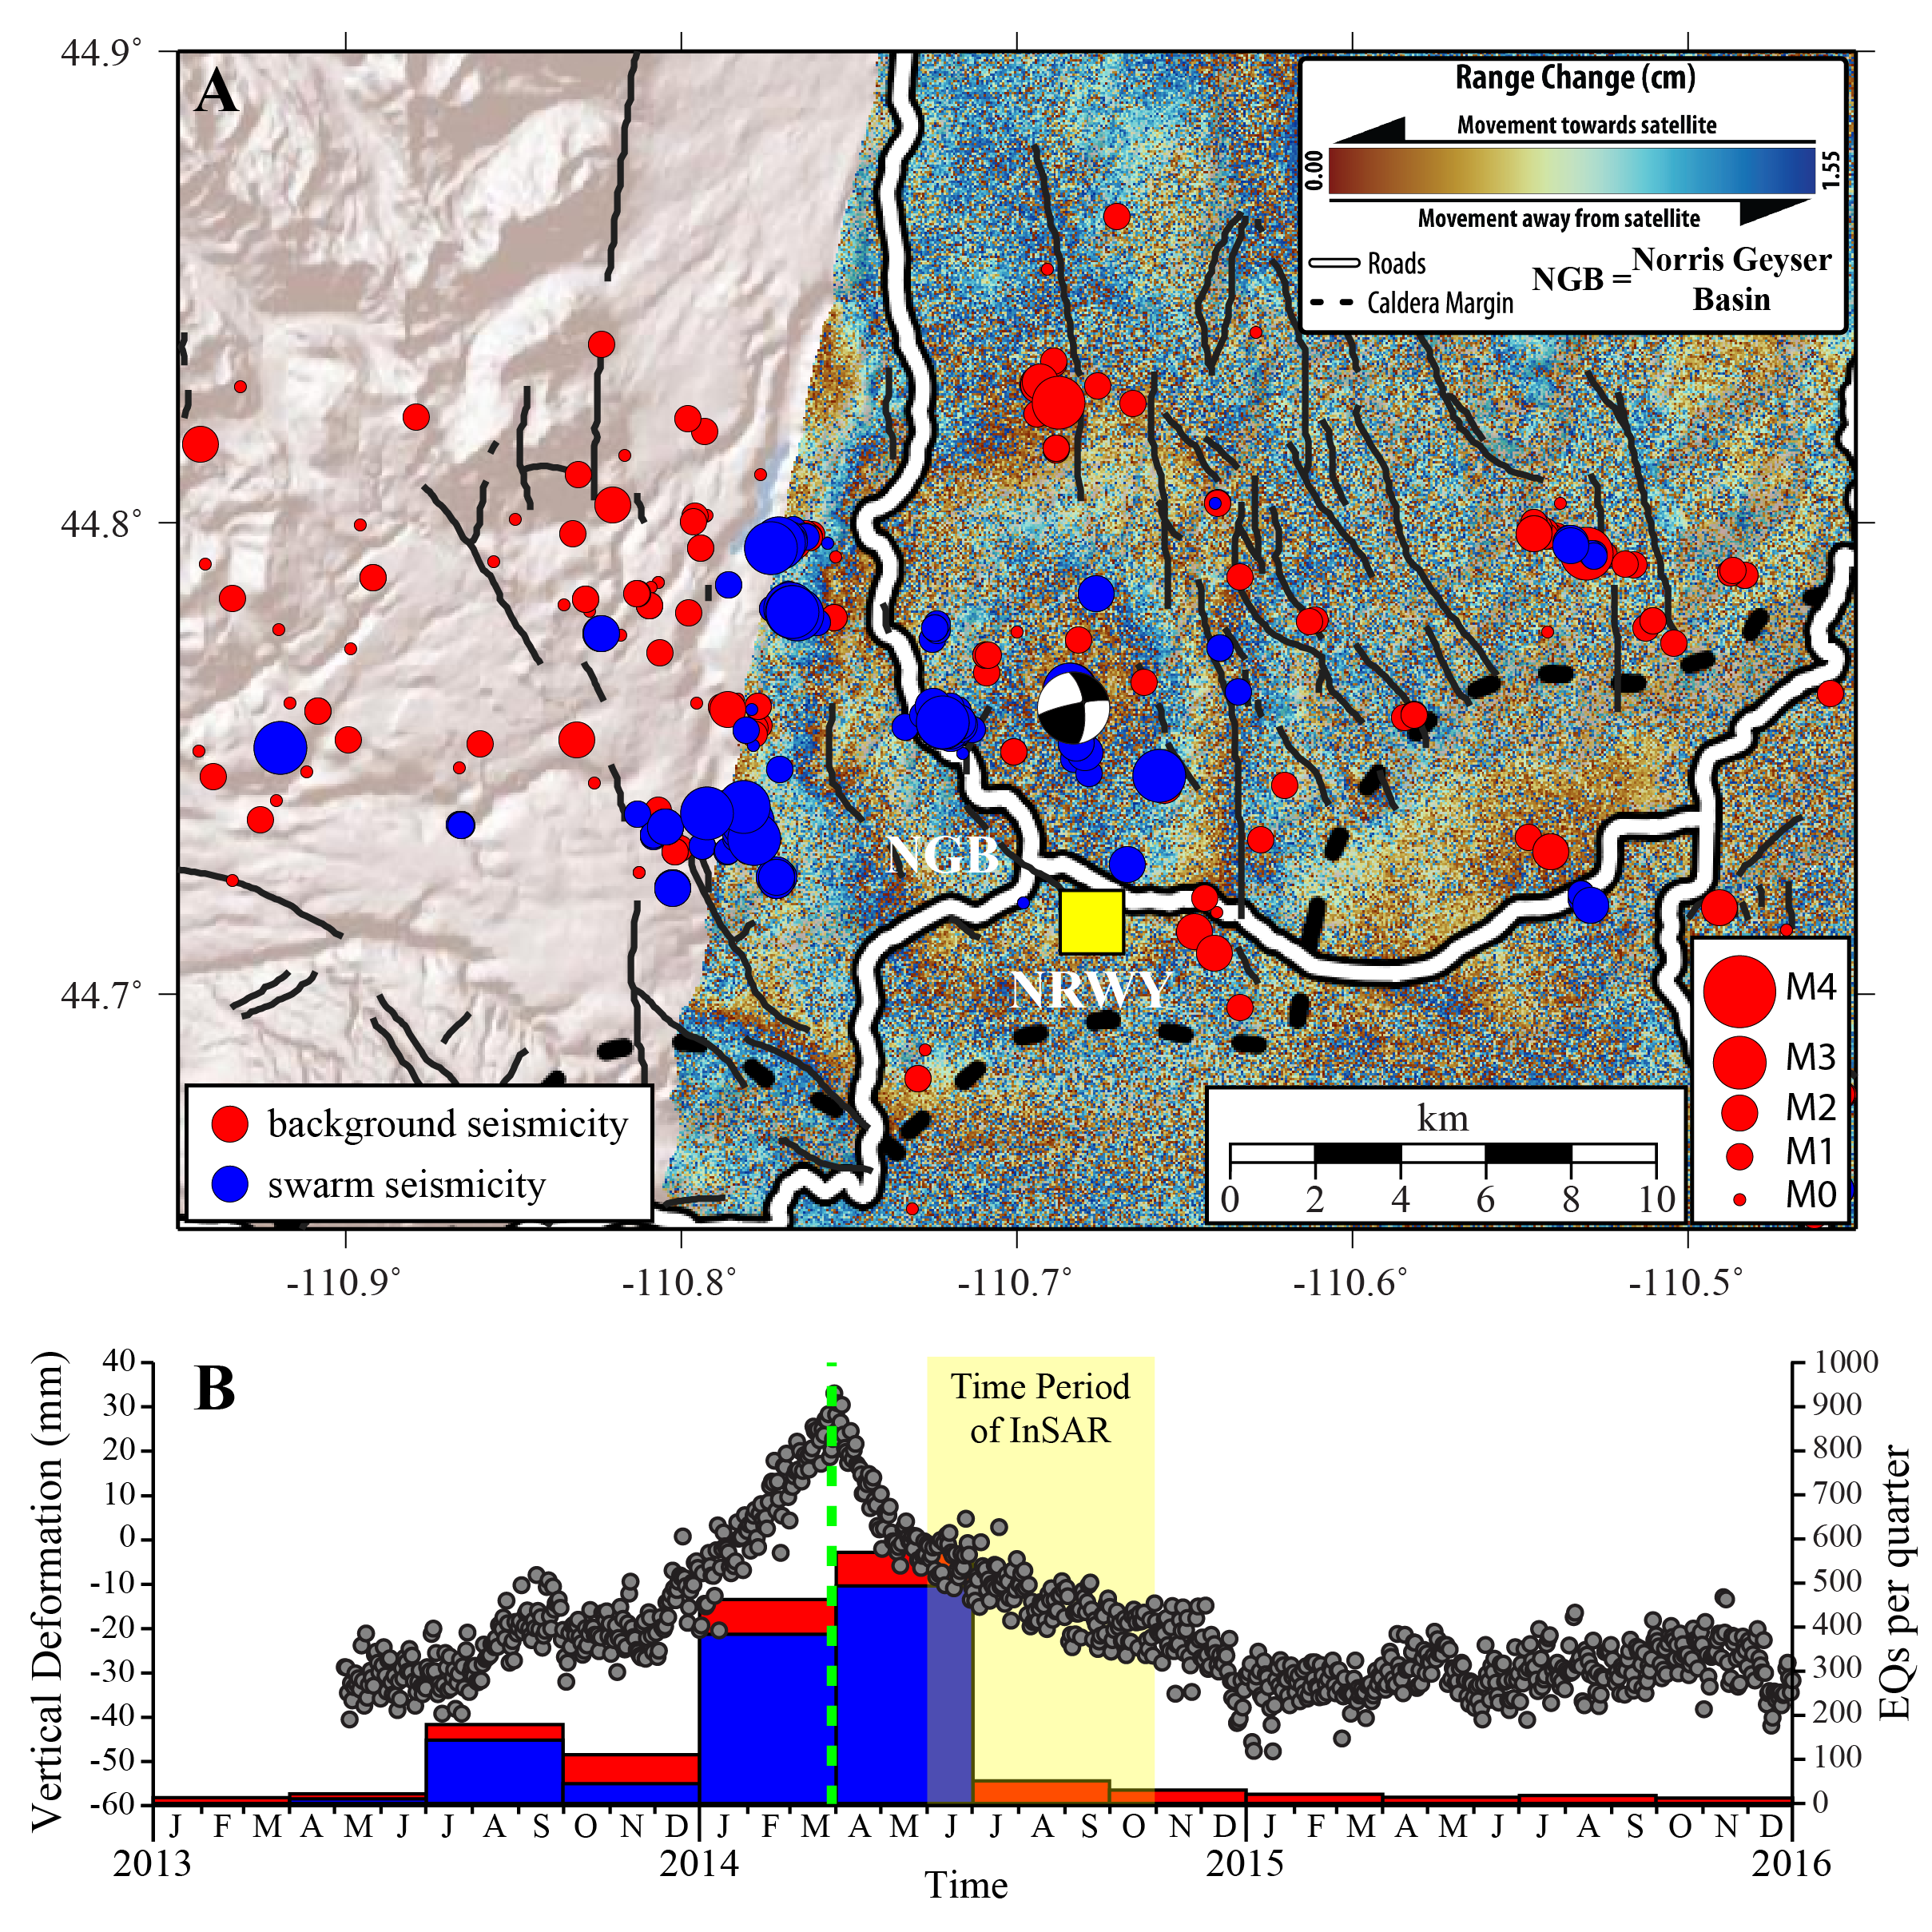
The 2013–2014 Norris Geyser Basin (NGB) uplift and associated earthquakes. (A) Map of the deformation as seen by interferometric synthetic aperture radar (InSAR) covering the time of subsidence during July – October 2014 that followed the uplift of the previous months. Plotted on top is the seismicity during 2013–2015, with background seismicity shown as red circles and swarm earthquakes shown as blue circles. The M4.8 event that occurred on March 30, 2014, is shown as the large focal mechanism (beach ball) that indicates the sense of motion on the fault that caused the earthquake (in this case, mostly as strike-slip motion). (B) Time-series plot showing the 2013–2014 vertical deformation as recorded by GPS station NRWY and the associated seismicity. The timing of the M4.8 earthquake is shown by the dashed green line. The time-period of the InSAR image shown in (A) is denoted by the yellow shaded region.
Sources/Usage
Public Domain.