
2021 JWP Working Group Image - Time-dependent Decisions

Detailed Description
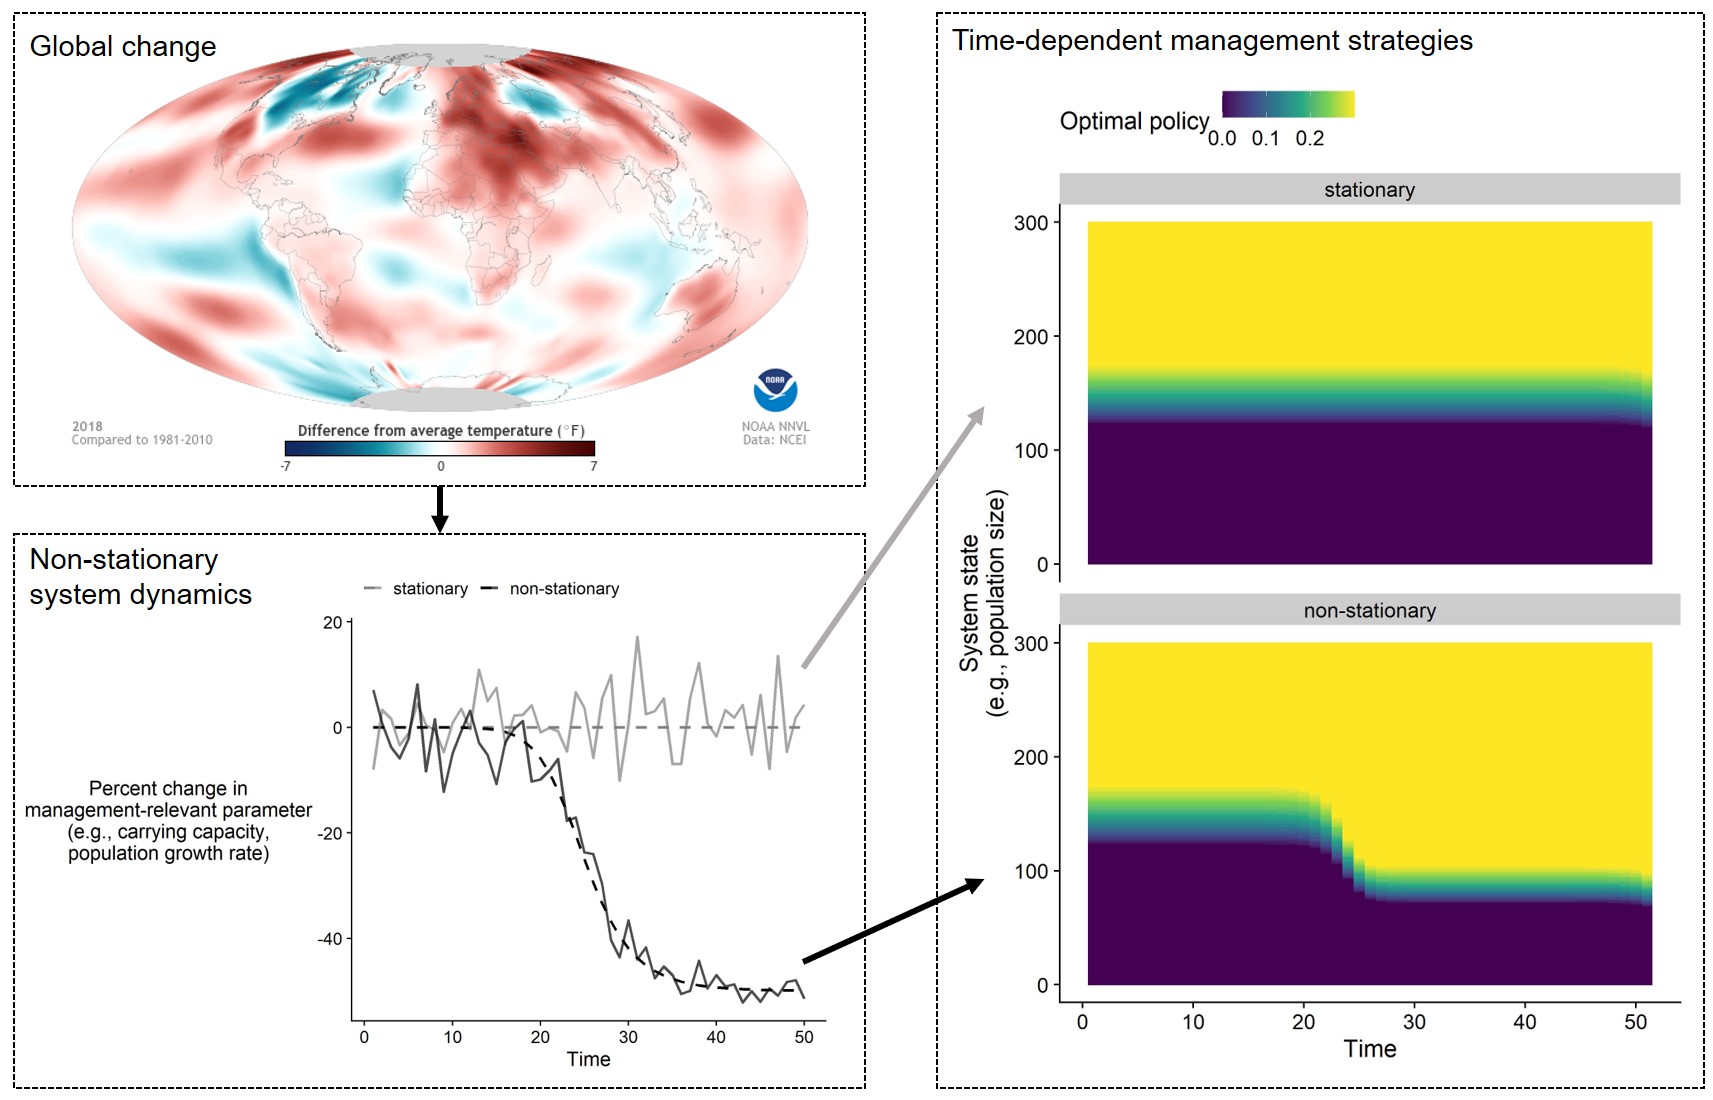
A conceptual diagram showing the links between global change, non-stationary dynamics in natural systems, and time-dependent optimal strategies for natural resource management. In the top left panel, global change is depicted as a map showing difference in average temperature experienced in 2018 relative to 1981-2010 (NOAA NNVL, Data: NCEI). In the bottom left panel is a figure showing the percent change in a management-relevant parameter (e.g., carrying capacity or population growth rate) over time under both stationarity (constant) or non-stationarity (declining). In the right panel, theoretical time-dependent optimal policies are shown for both the stationary and non-stationary scenarios.
Sources/Usage
Public Domain.