
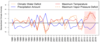
A graph of vapor pressure deficit and temperature in a tree cover study area in California

Detailed Description
The highlighted area on this graph of vapor pressure deficit and temperature in a blue oak tree cover study area in California shows the prolonged drying and warming that occurred from 2012 to 2016. Learn more about the study. USGS EROS graph
Sources/Usage
Public Domain.