



Annual U.S. production of materials over time
By Mineral Resources Program
May 2026 (approx.)
Detailed Description
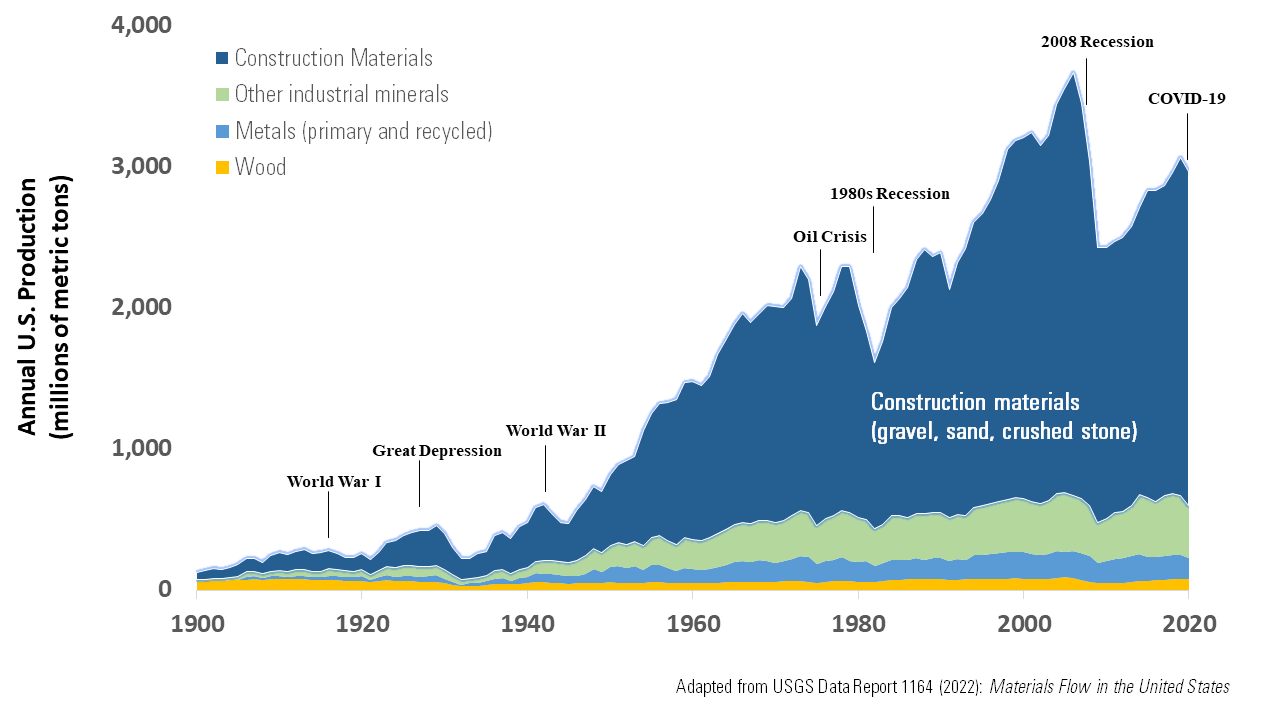
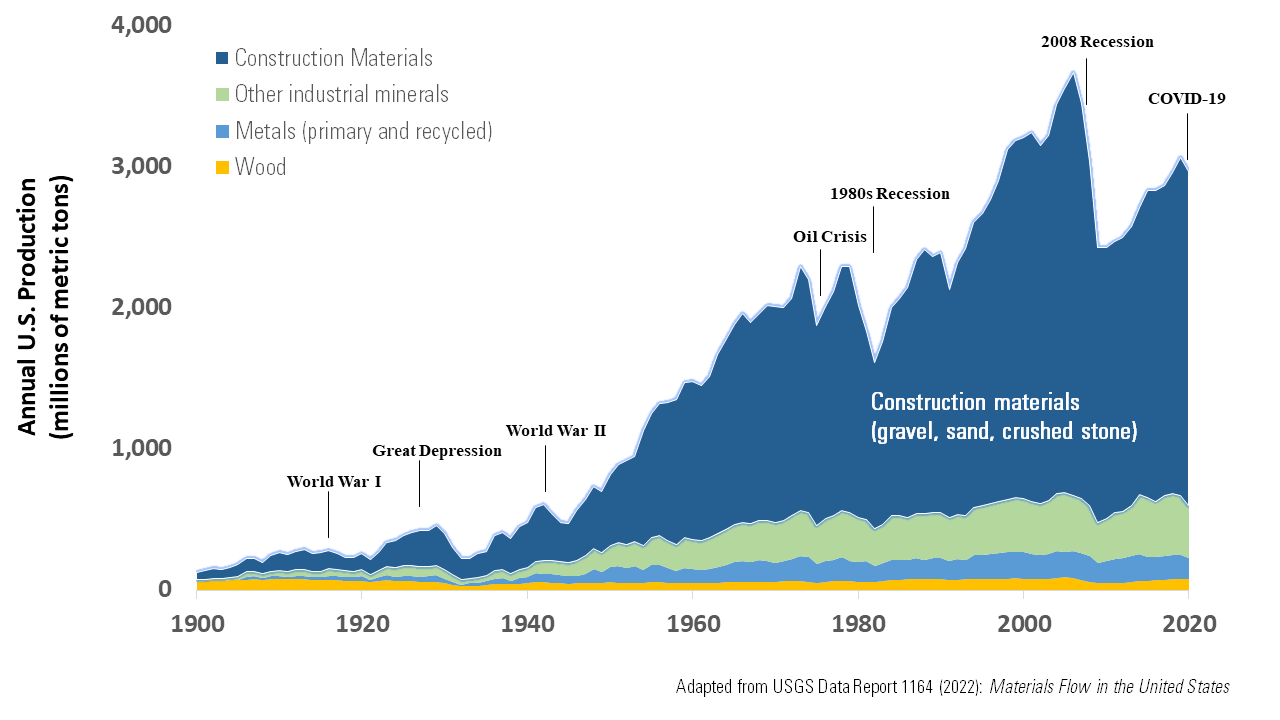
Graph of U.S. production (in millions of metric tons) of materials from 1900 to 2020, adapted from Materials flow in the United States—A global context, 1900–2020.
The graph shows that production of construction materials has greatly outpaced increases in production of other industrial minerals, metals and wood. The graph also shows how major events are reflected by increases in production (such as World War II) or decreases in production (such as the 1980s and 2008 recessions and Covid-19).
Sources/Usage
Public Domain.
Related

Building America: USGS and the Nation's Construction Materials
Through mapping and science, the USGS is helping find mineral materials needed for construction across the Nation.
Related
Building America: USGS and the Nation's Construction Materials
Through mapping and science, the USGS is helping find mineral materials needed for construction across the Nation.