
Boreal Toad Dashboard
Detailed Description
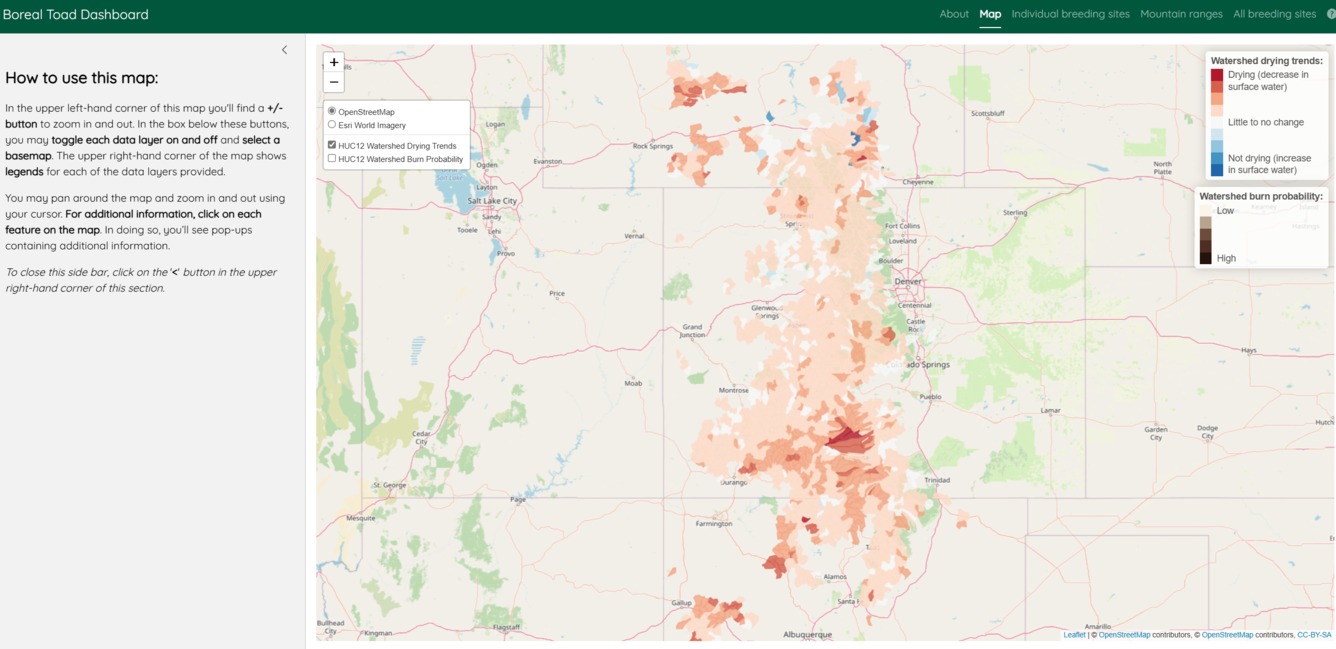
Screenshot of the Map tab in the Boreal Toad Dashboard. The Boreal Toad Dashboard is a decision-support tool that allows to researchers to explore current and future occupancy trends of the boreal toad and amphibian chytrid fungus throughout the Southern Rocky Mountains.
The map in this screenshot displays Watershed drying trends across HUC12 watersheds, from drying (decrease in surface water, more red), to little to no change (white), to no drying (increase in surface water, more blue). Text on in the sidebar on the left reads:
How to use this map:
In the upper left-hand corner of this map you'll find a +/- button to zoom in and out. In the box below these buttons, you may toggle each data layer on and off and select a basemap. The upper right-hand corner of the map shows legends for each of the data layers provided.
You may pan around the map and zoom in and out using your cursor. For additional information, click on each feature on the map. In doing so, you’ll see pop-ups containing additional information.
To close this side bar, click on the '<' button in the upper right-hand corner of this section.
Sources/Usage
Public Domain.