
CCL accuracy journal article figure

Detailed Description
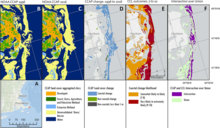
(A) Inset: Map showing location of (B–F). (B), (C) The C-CAP land cover for 1996 and 2016, respectively. (D) Land cover in the C-CAP datasets changed for coastal, noncoastal and low elevation (less than 1 m), and noncoastal land classes between 1996 and 2016. (E) The CCL 7–10, where the warmest colors represent the highest change likelihoods (9 and 10) in the next decade. (F) Areas of overlap and the intersection over union (IoU) between C-CAP change and CCL of 9 and 10.
Read the journal article to learn more:
Pendleton, E.A., Lentz, E.E., Henderson, R.E., Heslin, J.L., Bartlett, M.K., and Sterne, T.K., 2025, Assessing Decadal-Scale Coastal change Likelihood to Define the Accuracy and Application of Scientific Information: Journal of Coastal Research, Volume 41, Issue 5, https://doi.org/10.2112/JCOASTRES-D-24-00072.1.
https://jcr.kglmeridian.com/view/journals/coas/41/5/article-p770.xml
Sources/Usage
Public Domain.