
Chart showing the effectiveness of the three methods used to observe the Santa Ana Sucker
By California Water Science Center
March 2025 (approx.)

Detailed Description
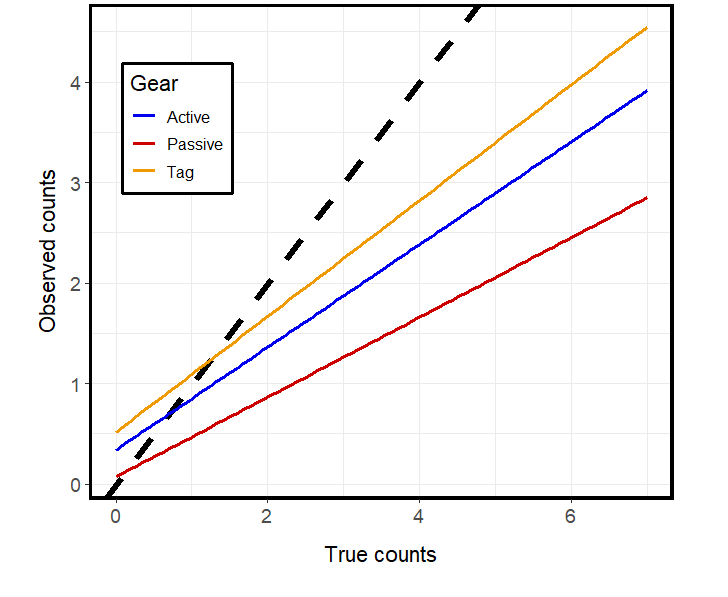
Chart showing the effectiveness of the three methods used to observe the Santa Ana Sucker. The black dashed line shows the true (or total) number of fish. The yellow line shows the number of fish the PIT tag reader was able to detect. The red line shows passive camera detections, and the blue line shows active camera detections. The closer the colored lines are to the true number of fish (black line) equates to the accuracy of the method.
Sources/Usage
Public Domain.