
Chart showing time-series from the entire 132-day deployment off the southwest Puerto Rico coast
Detailed Description
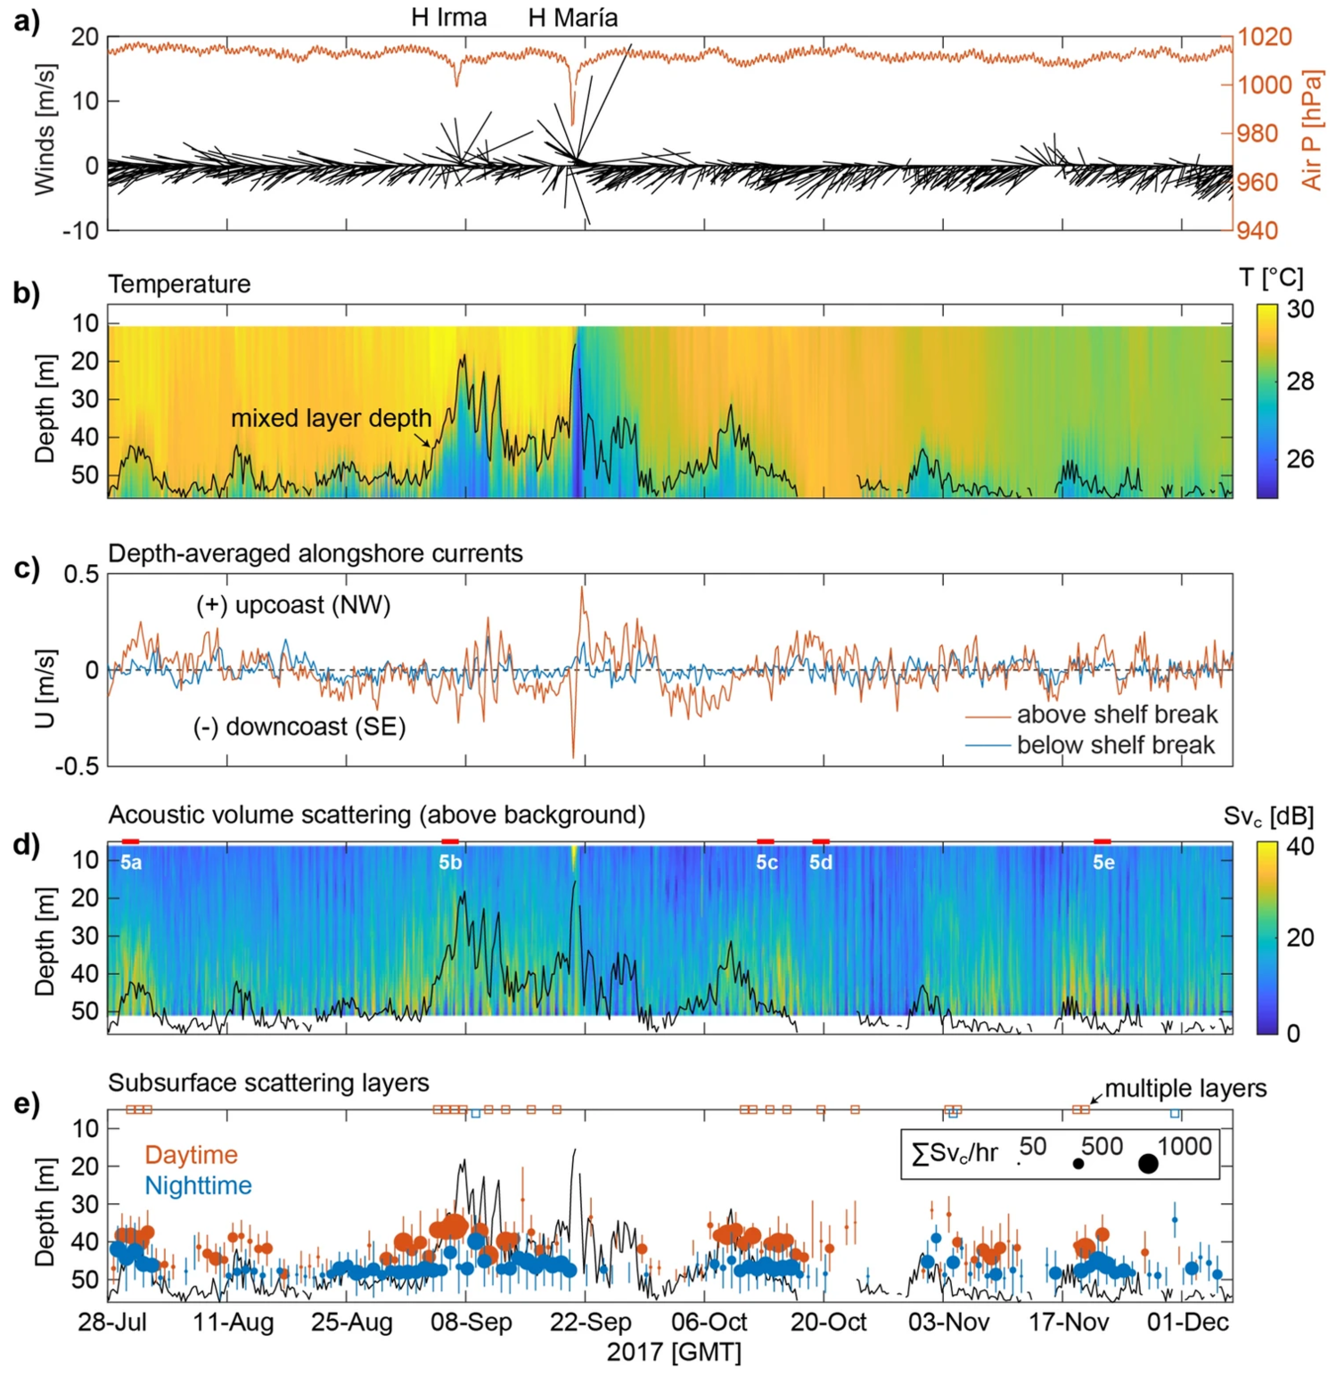
Time-series from the entire 132-d deployment. a Wind velocity (black vectors, left axis), and barometric pressure (orange line, right axis) measured by the Ponce buoy; the timing of two major tropical cyclones (TC), Irma and Maria, are labeled and correspond to the sharp dips in barometric pressure. b Temperature with the approximate mixed layer depth (MLD) overlaid (black line). c 3-h-averaged along-isobath currents averaged over depths above (orange line) and below (blue line) the shelf break; positive values indicate upcoast (northwest-directed) and negative values indicate downcoast (southeast-headed). d Corrected acoustic volume backscatter (Svc), with MLD overlaid (black line); 2-d time periods shown in Fig. 5 panels are indicated by red lines and white text labels. (e) Subsurface scattering layer (SSL) characteristics aggregated by day- (dark orange) and night-time (blue) periods: the mean SSL depth and vertical thickness (vertical lines), intensity (size of circle), and occurrence of multiple layers (squares at top of axis); the MLD (black line) is also overlaid. From the study Complex sound scattering layer and water-column dynamics over a mesophotic coral ecosystem: Southwest Puerto Rico, U.S.A.
Sources/Usage
Public Domain.