
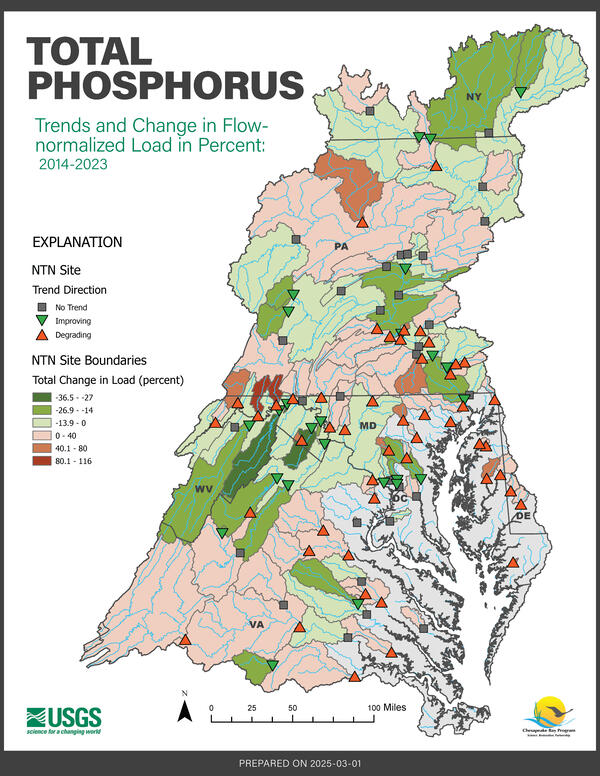
Chesapeake Bay Nontidal Network: 2014-2023 Total Phosphorus 10-year Trends and Percent Change in Flow-normalized Loads

Detailed Description
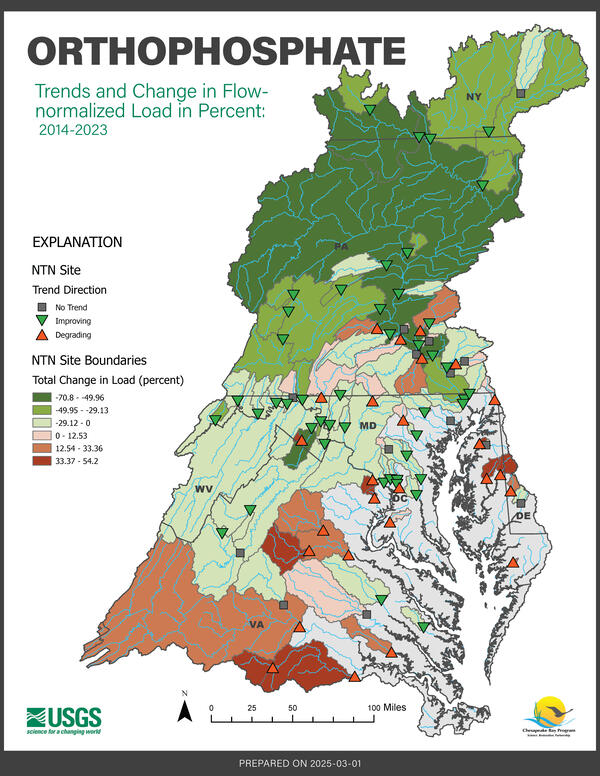
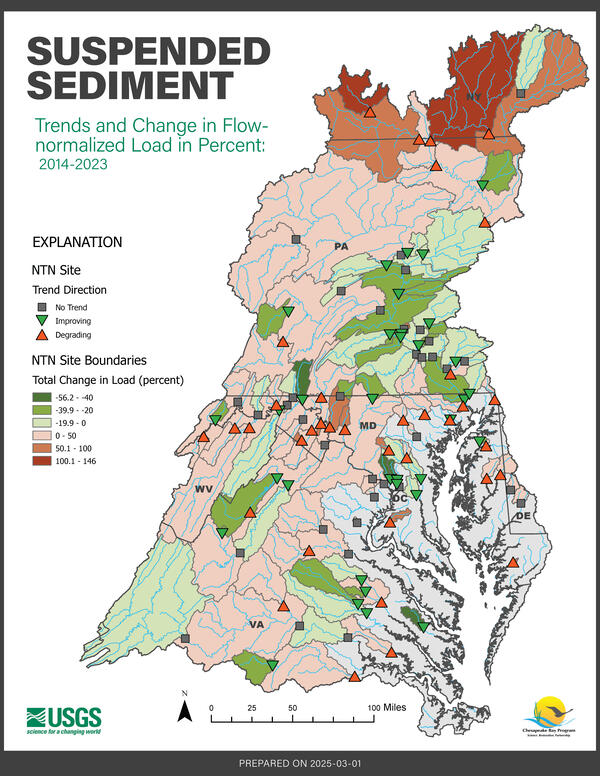
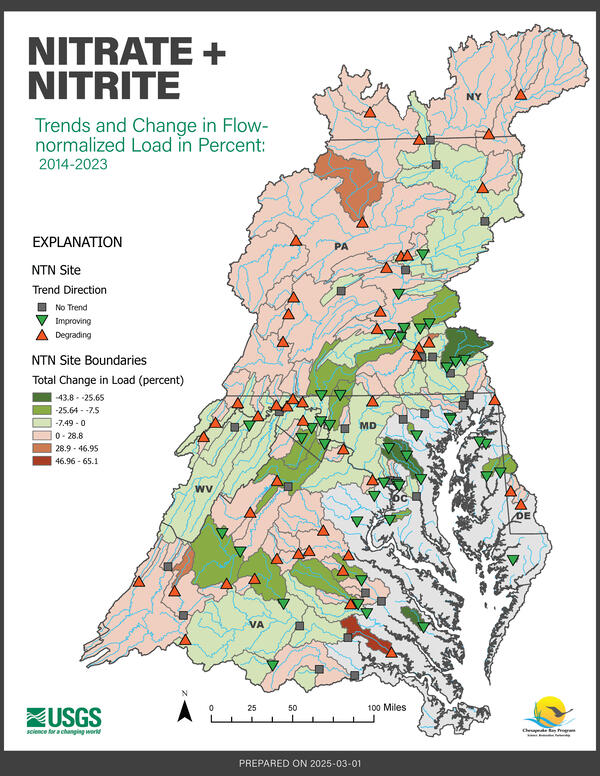
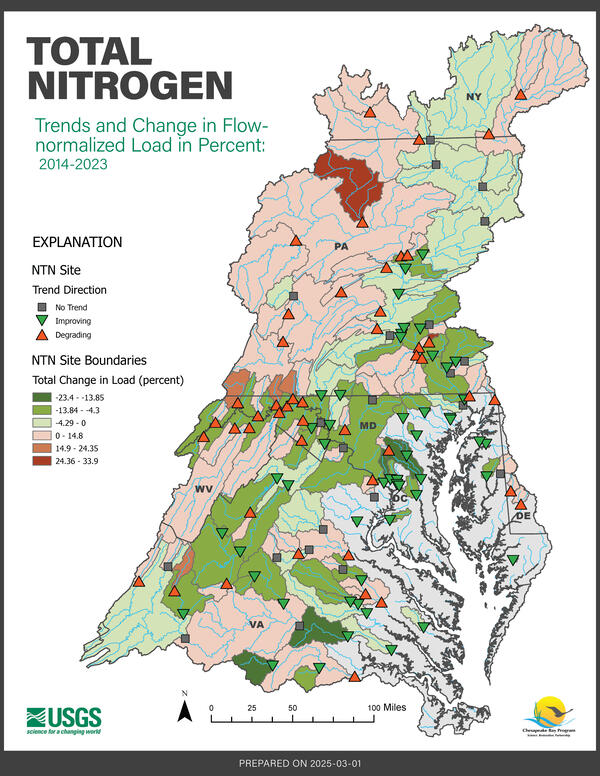
This map displays the 10-year trend for total phosphorus, as well as the percent total change in flow-normalized loads for total phosphorus across the Chesapeake Bay Watershed from 2014 to 2023.
Learn more about Chesapeake Bay Water-Quality Loads and Trends and the USGS Nontidal Network.
Sources/Usage
Public Domain.
Related
Chesapeake Bay 2014-2023 10-Year Trends and Percent Change in Flow-normalized Load
Chesapeake Bay 2014-2023 10-Year Trends and Percent Change in Flow-normalized Load
Related
Chesapeake Bay 2014-2023 10-Year Trends and Percent Change in Flow-normalized Load
Chesapeake Bay 2014-2023 10-Year Trends and Percent Change in Flow-normalized Load