
Contour Plots

Detailed Description
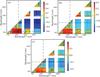
(a–c) Contour plots of the correlation between (a) f APAR-high, (b) f APAR-mid
and (c) f APAR-low values and two-band vegetation indices (TBVI) using all combinations of
164 Hyperion bands simulated using spectroradiometer data collected at Twitchell Island.
Dashed lines intersect at band combinations with the greatest r.