
Current and historical peak flow chart

Detailed Description
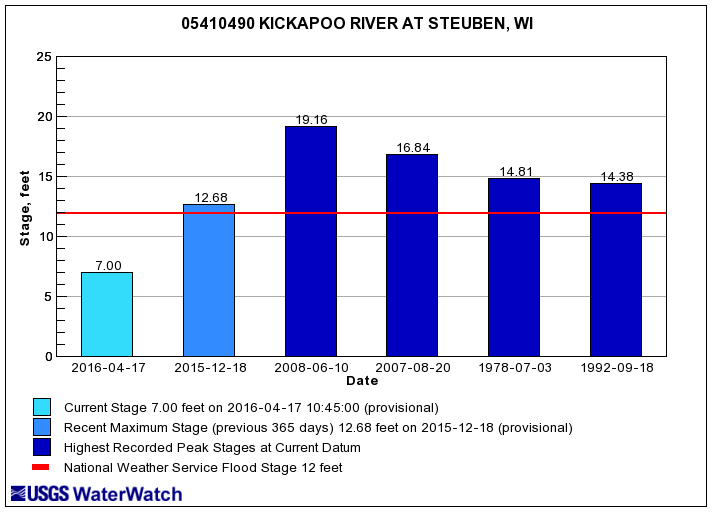
Example graph showing current stream stage (far left), highest stage in the past year (second from left), and the four highest historical peak stage measurements (four dark-blue bars on right). This chart also shows the National Weather Service flood stage for this site (red line).
Sources/Usage
Related

Flood hazards in Wisconsin
A summary of USGS resources and data related to flooding hazards in Wisconsin.
Related
Flood hazards in Wisconsin
A summary of USGS resources and data related to flooding hazards in Wisconsin.