
Deformation and seismicity during 2024-2025 associated with Norris Uplift Anomaly, Yellowstone National Park

Detailed Description
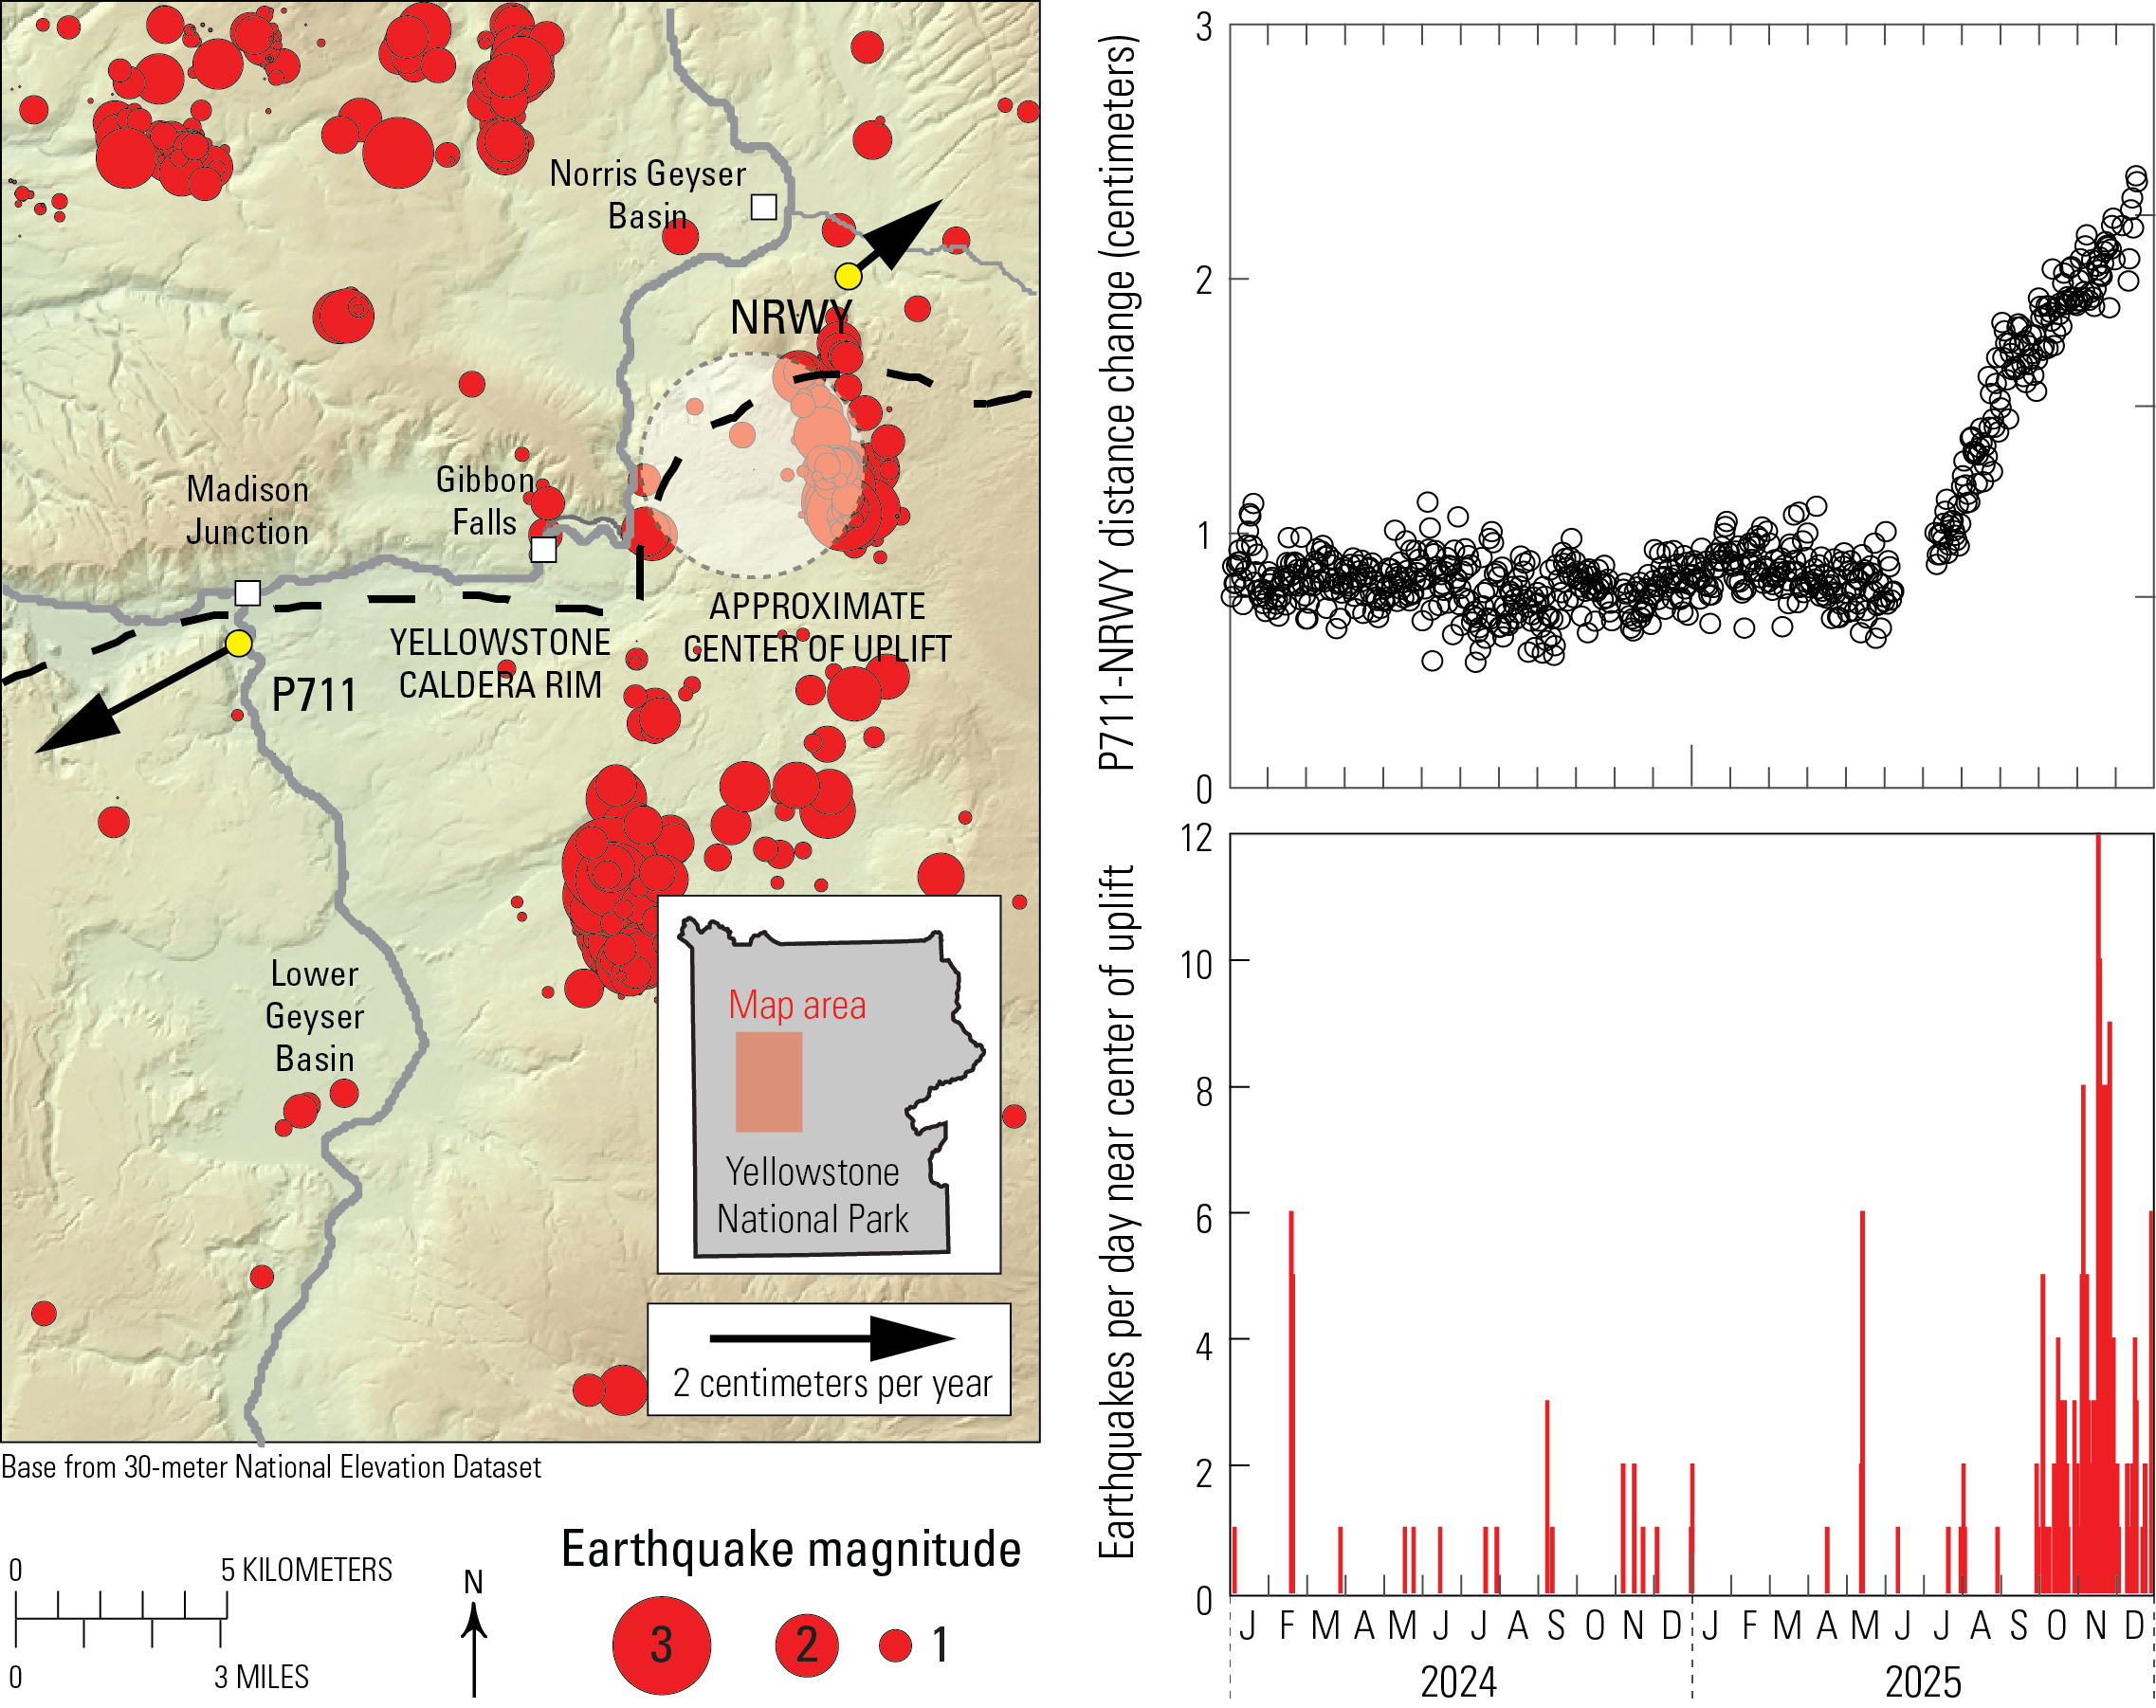
Map of horizontal velocities between July and December 2025 at Global Positioning System (GPS) stations P711 and NRWY (arrows and yellow circles; arrow length gives displacement rate) in the area between Norris Geyser Basin and Madison Junction. Dashed black line indicates boundary of Yellowstone Caldera and gray lines are roads. White circle is approximate center of uplift that became active in July 2025. Red circles are earthquakes located during 2024-2025 (circle size scales with magnitude). Top right plot shows distance change between GPS sites P711 and NRWY, which span the uplifting area. Positive change indicates extension, which is consistent with uplift beginning in July 2025 and reaching about 1.5 centimeters (0.6 inch) by the end of the year. Lower right plot is number of earthquakes per day in the immediate area of uplift during 2024-2025. The number of earthquakes in the area was elevated during September-December 2025.
Sources/Usage
Public Domain.