
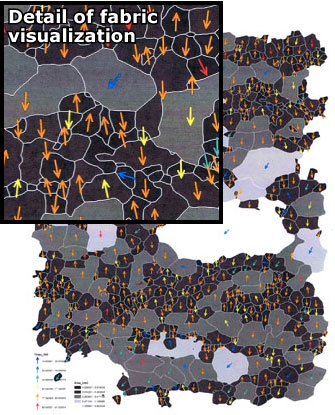
Fabric visualization of ice crystals created by ArcGIS process

Detailed Description
Fabric visualization using ArcGIS. Crystal orientation and size information can be classified and mapped onto the grain-boundary image of a sample. This type of analysis can reveal spatial relationships that may not be readily perceived in the numerical analysis alone.