
Graphs of ground deformation and earthquake data spanning three eruptions at Mauna Loa.
Detailed Description
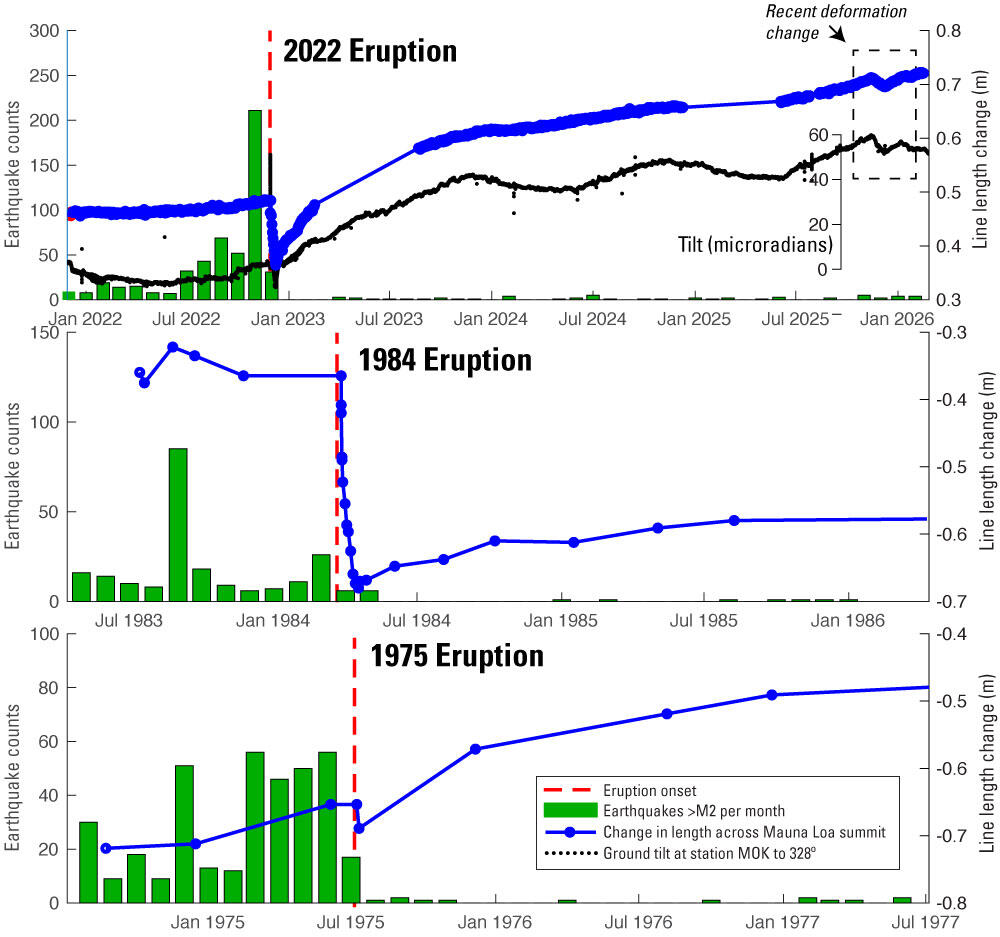
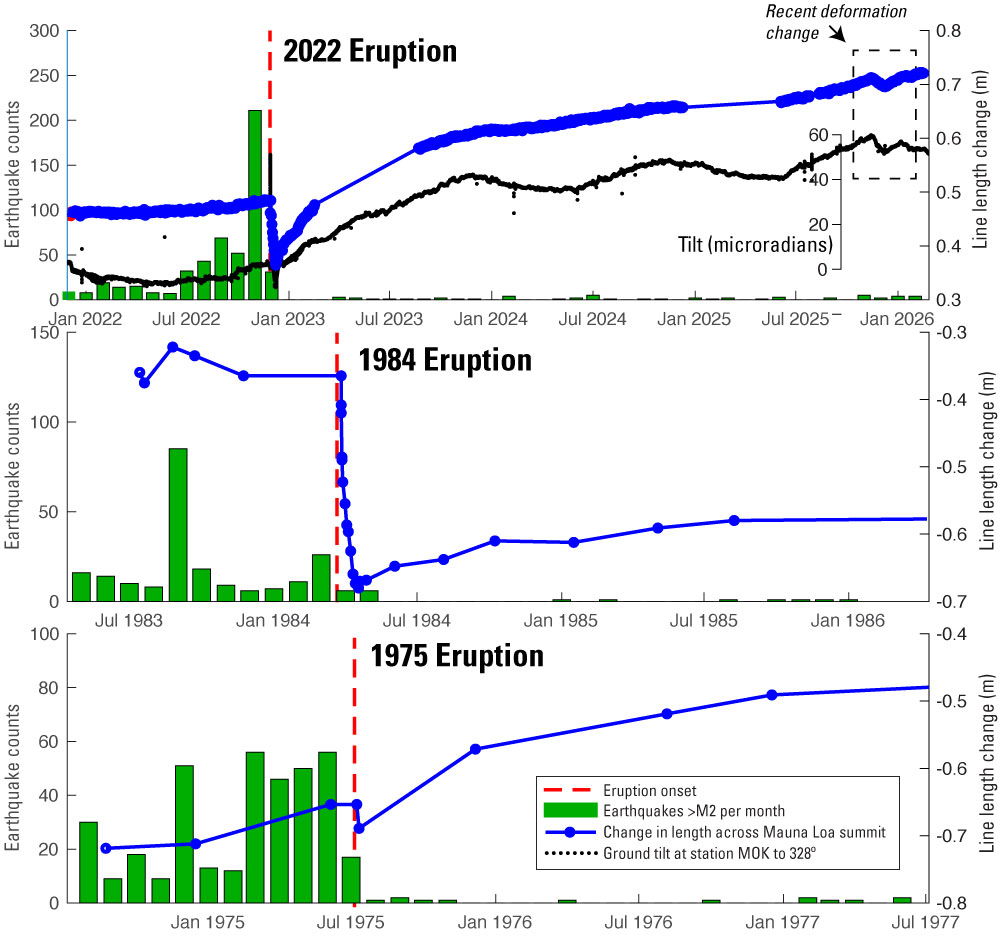
Graphs of ground deformation and earthquake data spanning three eruptions at Mauna Loa. Top panel spans the 2022 eruption, middle is for the 1984 eruption, and the bottom panel spans the 1975 eruption. Green bars show the number of earthquakes with magnitude greater than 2 during each month; in all cases earthquake rate drop off significantly following an eruption. Blue points and lines are line length changes measured by Electronic Distance Meters (EDM) during 1975 and 1984 and by GPS in 2022, between two stations spanning Mokuʻāweoweo, the summit caldera. An estimate of the line length changes due to the opening fissures has been removed from all three timeseries. Black points in the top panel are ground tilt measurements from a tiltmeter at the summit of Mauna Loa, installed in 1999. Yearly variations in tilt (gentle oscillations) are seasonal noise. Following all three eruptions, rapid lengthening of the line across the summit indicated refilling (inflation) of the shallow magma chamber without significant seismicity in the first 1-2 years after an eruption.
Sources/Usage
Public Domain.