



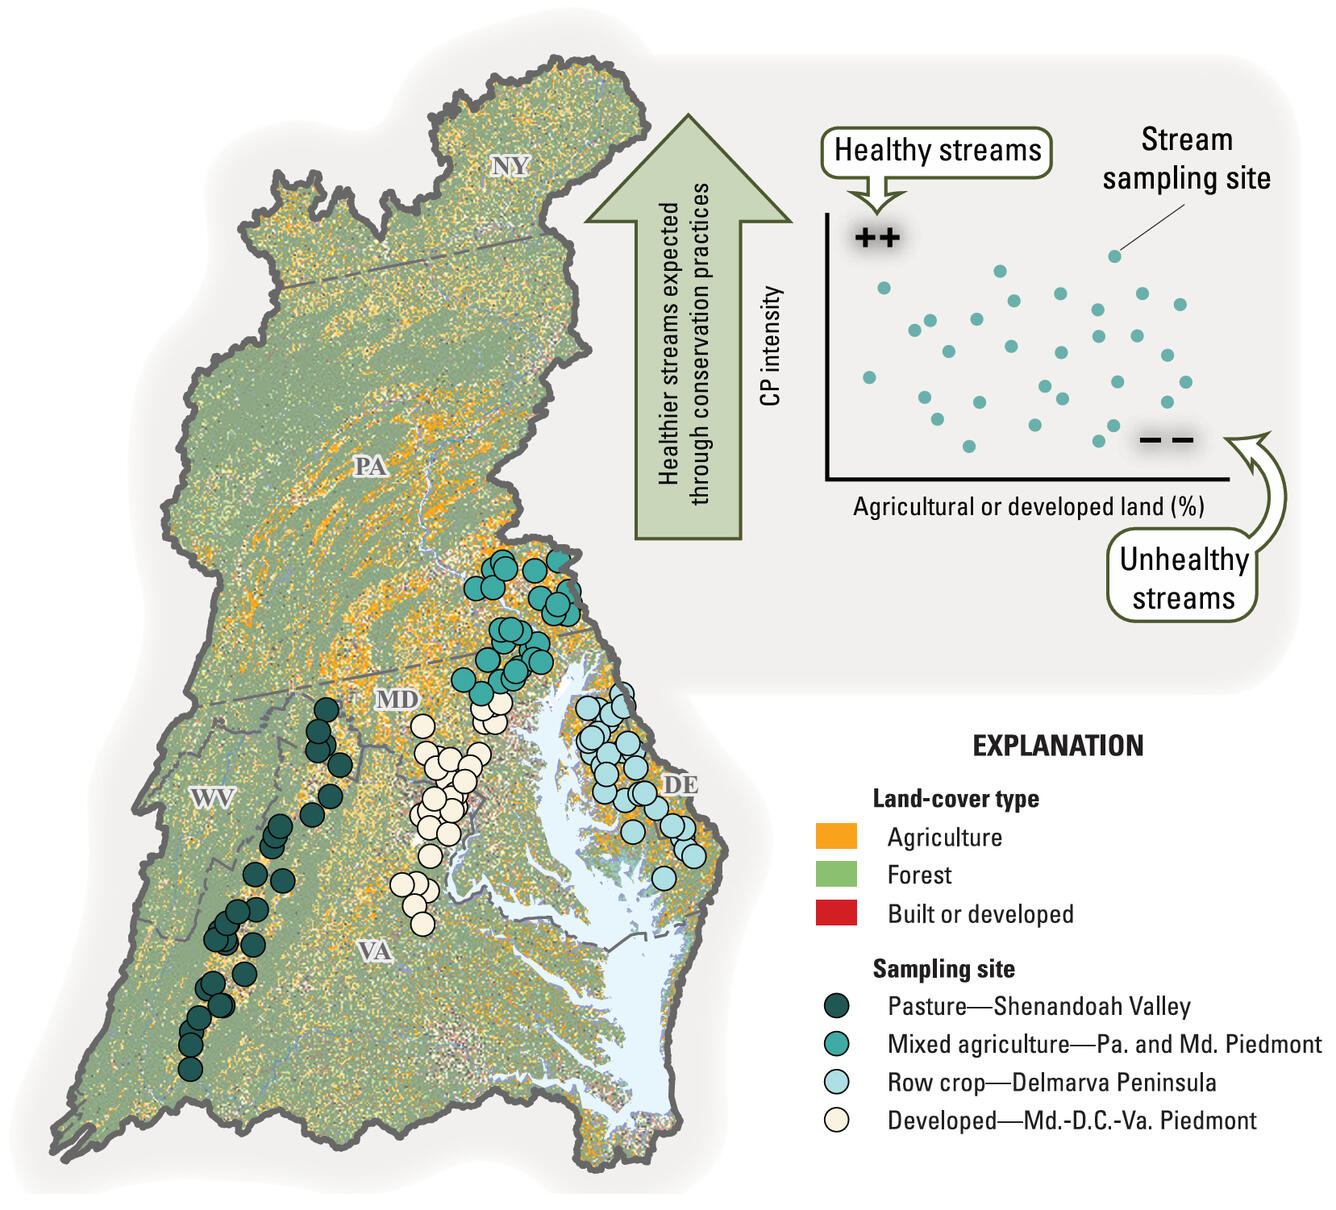
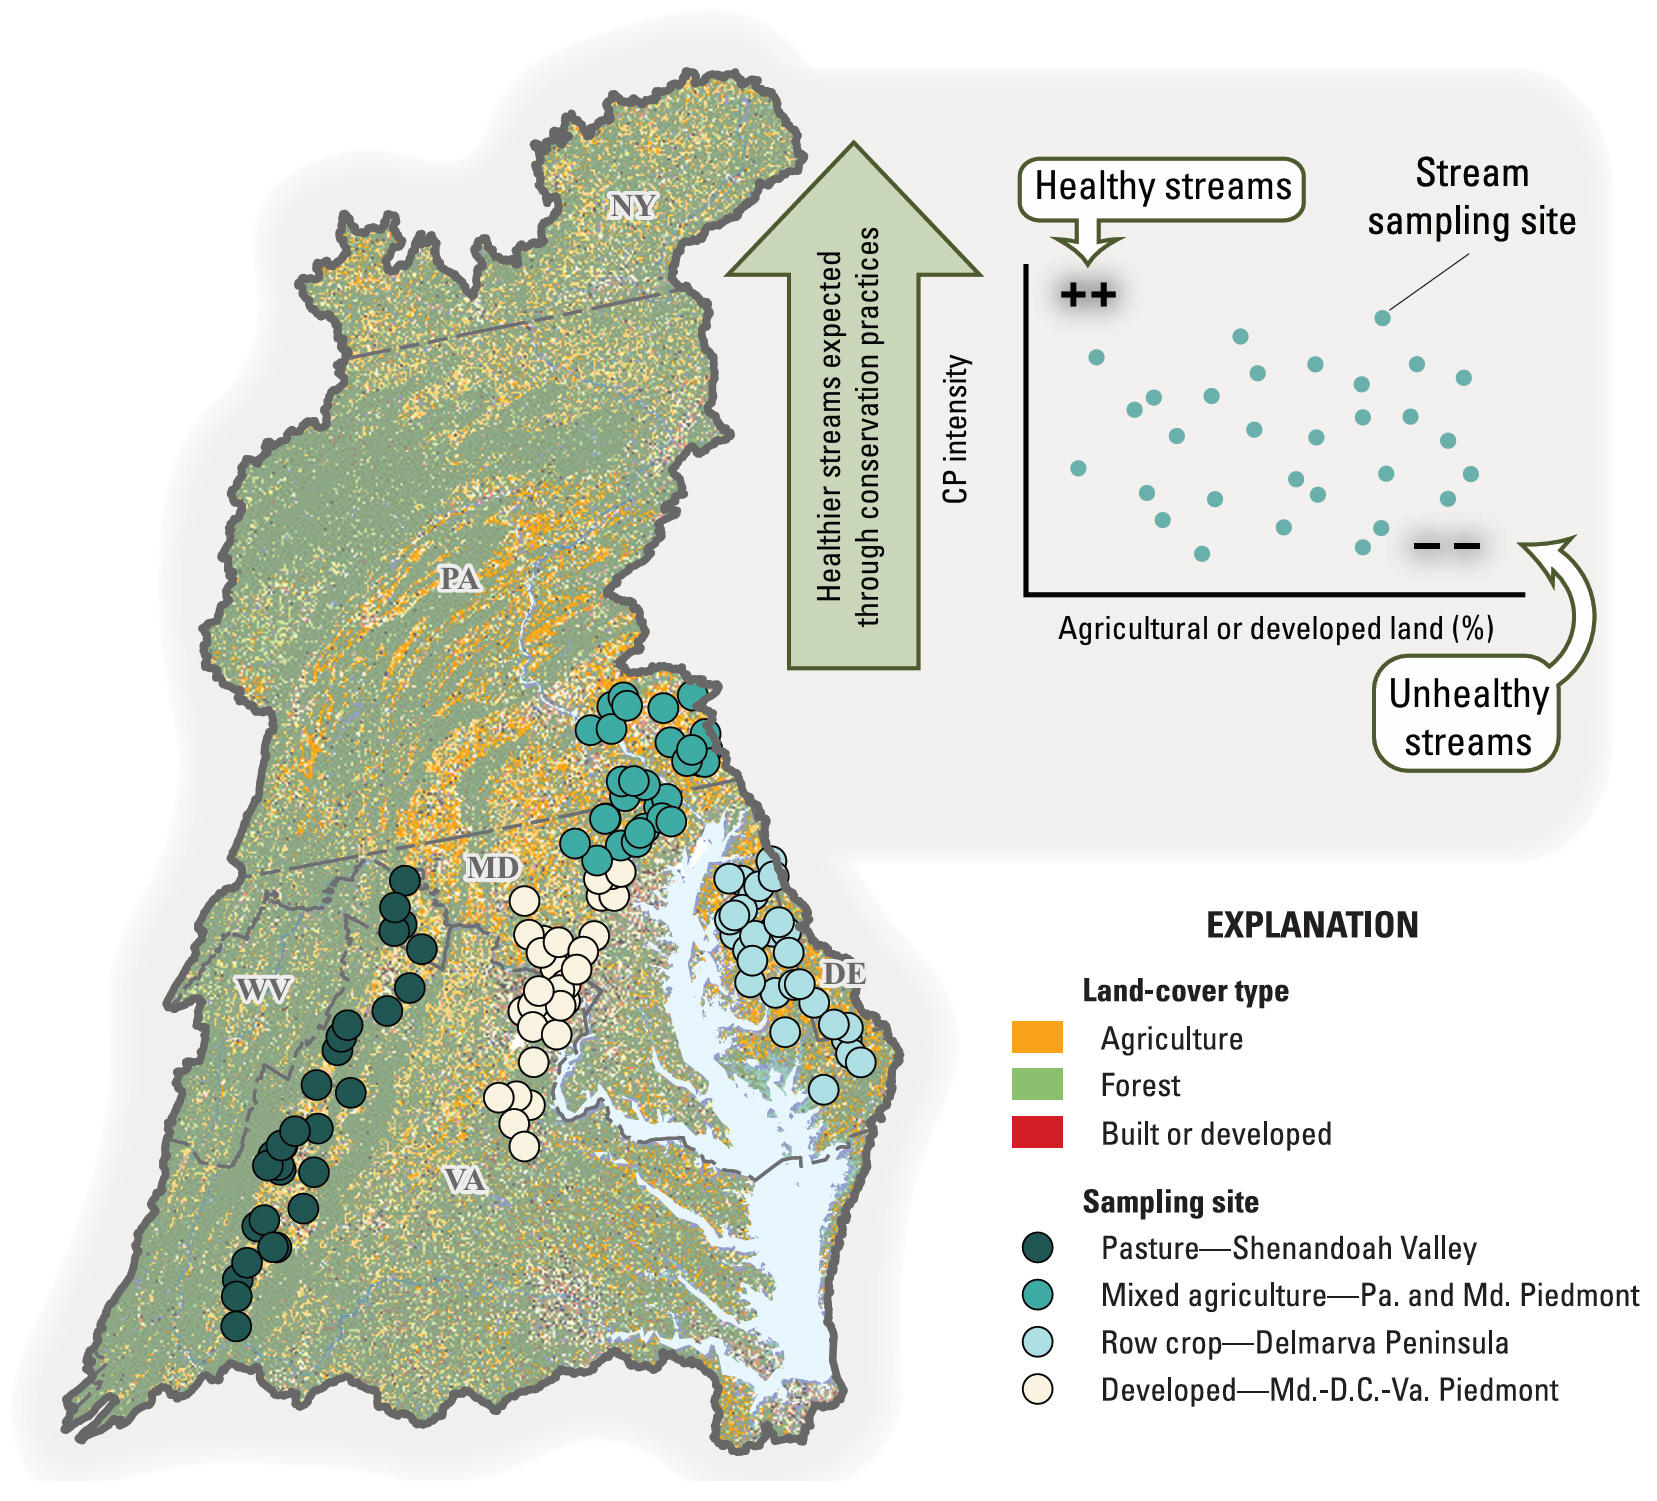
Map of sampling locations and a graph plotting stream-health expectations across gradients of conservation practices and land use in the Chesapeake Bay Watershed
By Chesapeake Bay Activities
July 2024 (approx.)
Detailed Description
Map of sampling locations (left) and a graph plotting stream-health expectations across gradients of conservation practices and land use (top right). The map shows locations of streams measured in agricultural and developed landscapes. In the plot, the streams (each shown as a blue dot) expected to be the healthiest are shown in the top left of the graph, streams expected to be the most-degraded are shown in the bottom right of the graph, and streams expected to be healthier due to conservation practices across the land-use gradient are shown in the top half of the graph. CP, conservation practice; D.C., District of Columbia; Md., Maryland; Pa., Pennsylvania; %, percent; Va., Virginia.
Sources/Usage
Public Domain.
Related
Chesapeake Stream Team
Connecting Conservation Practices to Local Stream Health in the Chesapeake Bay Watershed
Related
Chesapeake Stream Team
Connecting Conservation Practices to Local Stream Health in the Chesapeake Bay Watershed