
Modeled barrier island behavior, drowning time, and net shoreline change
Detailed Description
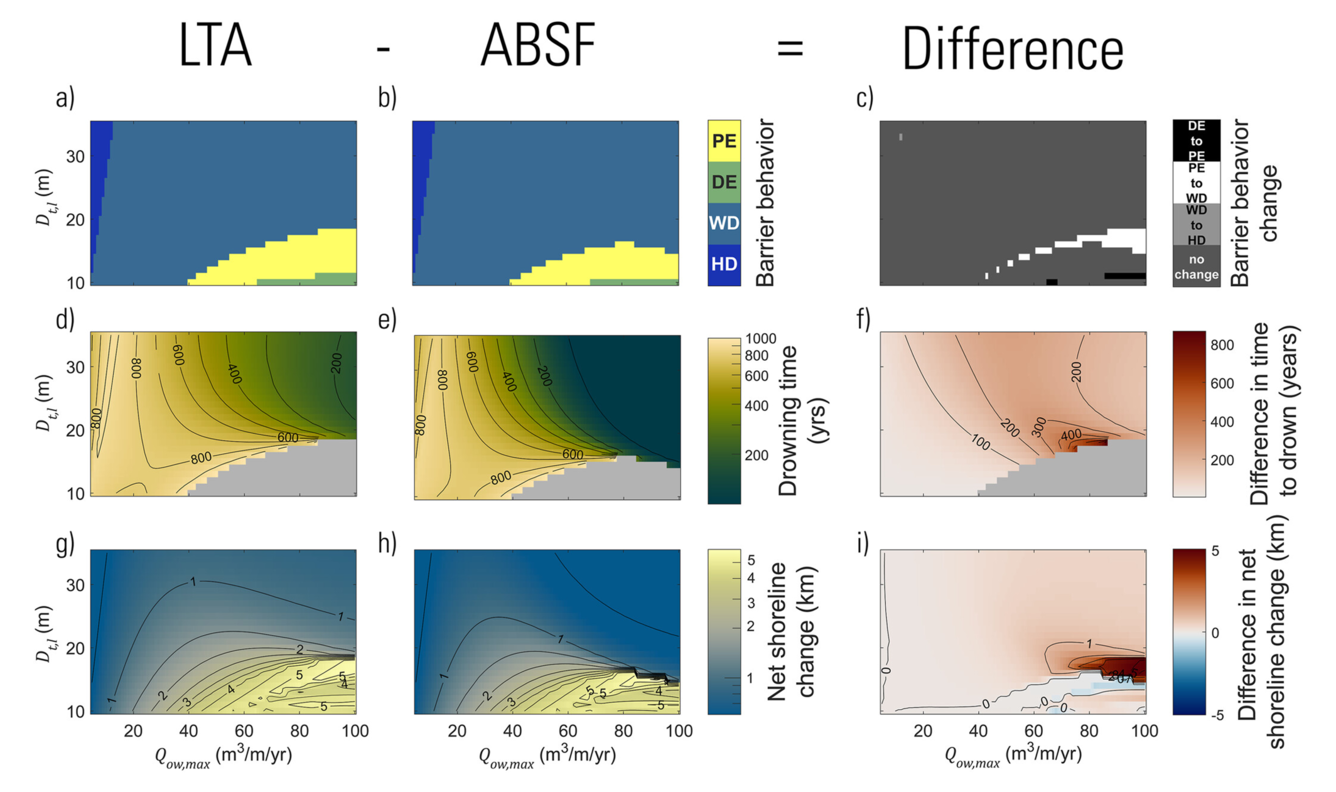
Barrier behavior, drowning time, and net shoreline change for a range of overwash flux and lower shoreface toe depths modeled by the LTA and ABSF. (a, b) Barrier behavior (PE, Periodic Equilibrium; DE, Dynamic Equilibrium; WD, Width-drowning; HD, Height-drowning), (d, e) drowning time (yrs), and (g, h) net shoreline change (km) for the LTA (a, d, g), the ABSF (b, e, h), and the difference between the LTA and ABSF (c) barrier behavior, (f) drowning time (yrs), and (i) net shoreline change (km) for barriers with maximum overwash flux ranging from 5 to 100 m3/m/yr and lower shoreface depth ranging from 10 to 35 m after 1,000 years simulation time. LTA simulations have depth averaged input values of shoreface response rate and equilibrium slope of comparable ABSF simulations. For ABSF, the remaining input parameters include 7 m upper shoreface depth, 6,000 m3/m/yr , 3,000 m3/m/yr , 0.016 , and 0.014 . Rate of sea-level rise for all model scenarios is 4.6 mm/yr. From the study Modeling the Influence of Upper and Lower Shoreface Dynamics on Barrier Island Evolution.
Sources/Usage
Public Domain.