



National Minerals Information Center products
By Mineral Resources Program
November 2026 (approx.)


Detailed Description
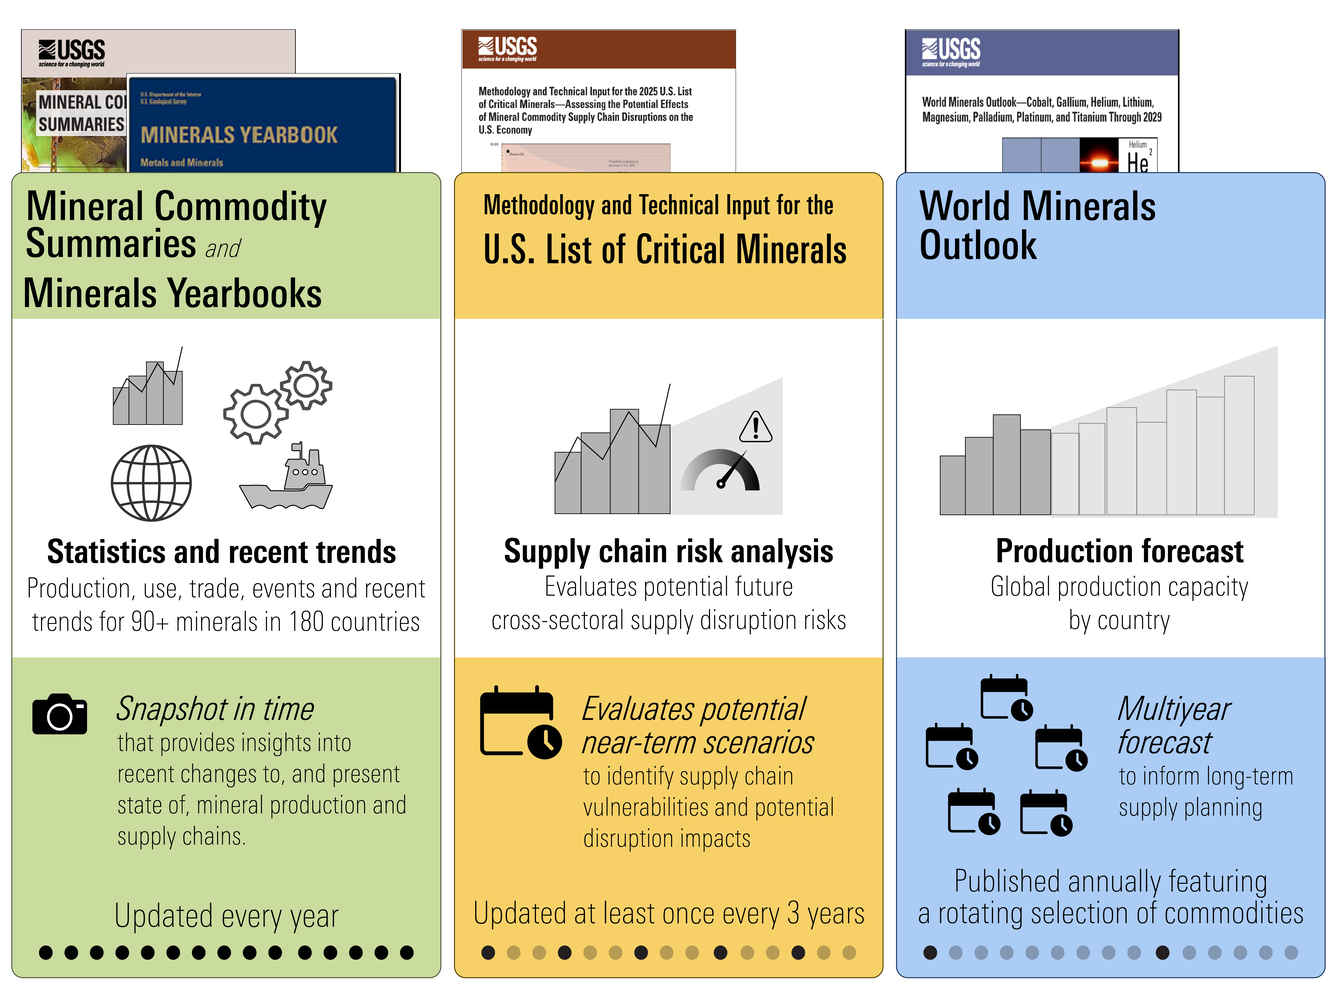
This infographic describes four major, periodic products from the USGS National Minerals Information Center, each represented by their publication covers:
Mineral Commodity Summaries and Minerals Yearbooks
- Provides statistics and recent trends including the production, use, trade, events and recent trends for 90+ minerals in 180 countries
- Icons indicate a production bar chart with line graph overlaid, gears symbolizing use, a globe symbolizing global perspective, and a ship indicating trade.
- These publications provide a snapshot in time (symbolized by a camera) that provides insights into recent changes to, and present state of, mineral production and supply chains
- These products are updated every year
Methodology and Technical Input for the U.S. List of Critical Minerals
- Provides an analysis of supply chain risk: evaluates potential future cross-sectoral supply disruption risks
- Icon indicates recent production and supply data (symbolized by bar and line data) providing insights into near-term future risks (indicated by gray forecast with a risk meter showing a warning icon)
- This publication evaluates potential near-term scenarios to identify supply chain vulnerabilities and potential disruption impacts
- The U.S. List of Critical Minerals is updated at least once every 3 years
World Minerals Outlook
- Provides a forecast of global production capacity by country
- Icon indicates recent production (symbolized by bar chart) providing insights into a multi-year forecast (symbolized by gray forecast with light gray bar graph indicating potential production capacity)
- This publication is a multiyear forecast to inform long-term supply planning
- This product is published annually featuring a rotating selection of commodities (such that each commodity is only featured periodically)
Sources/Usage
Public Domain.