
PRISM4 - Mean Annual Temperature Profiles
Detailed Description
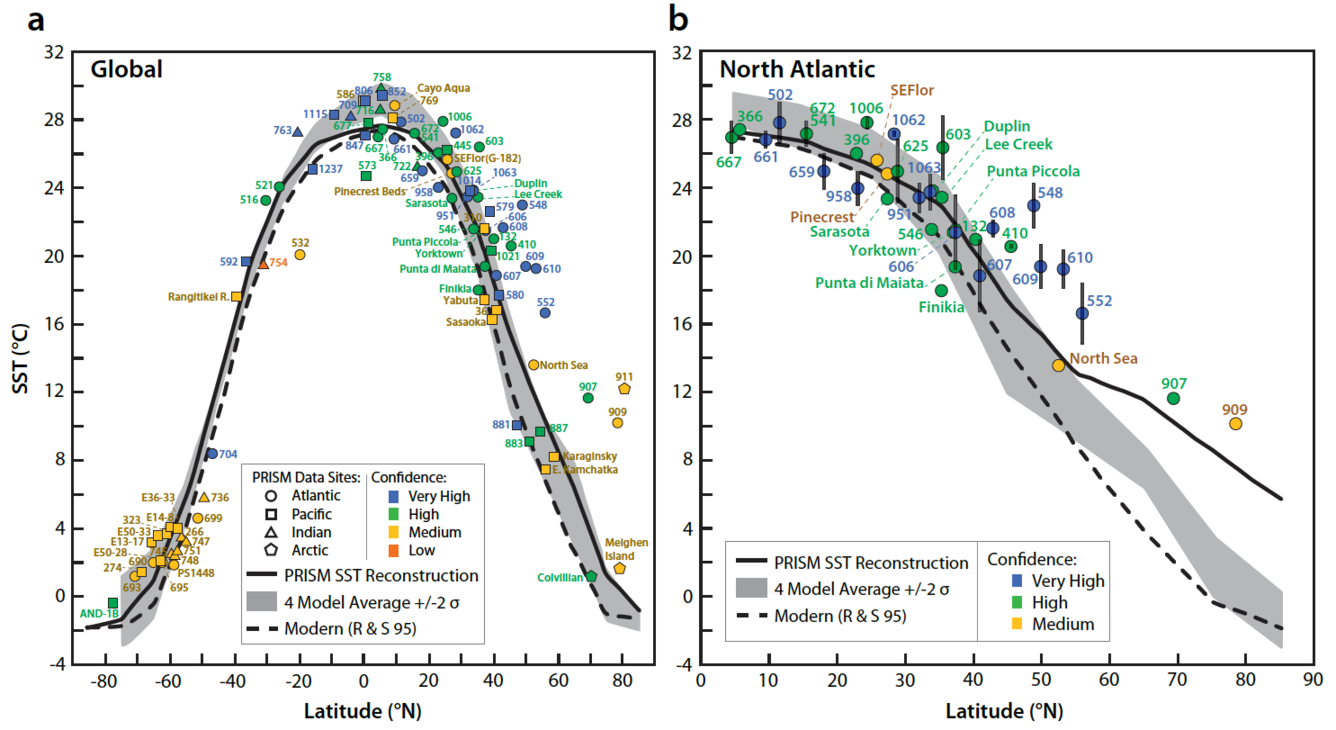
Data and model mean annual temperature profiles. a, Verification dataset SST estimates superimposed on zonally averaged multimodel mean annual SST from four climate-model simulations shown as grey band with width equal to ±2σ. Symbols indicate ocean basin; colours indicate level of confidence. Zonally averaged modern mean annual SST shown as dashed line, PRISM3 reconstruction shown as solid line. b, same as in a except North Atlantic region only, with ±2σ SST variability bars on deep-sea sites with better than 22 kyr sample resolution and multiple warm peaks in the SST-estimate time series.
Dowsett, H. J., Robinson, M. M., Haywood, A. M., Hill, D. J., Dolan, A. M., Stoll, D. K., Chan, W.-L., Abe-Ouchi, A., Chandler, M. A., Rosenbloom, N. A., Otto-Bliesner, B. L., Bragg, F. J., Lunt, D. J., Foley, K. M., and Riesselman, C. R.: Assessing confidence in Pliocene sea surface temperatures to evaluate predictive models, Nature Climate Change, 2, 365-371, 10.1038/NCLIMATE1455, 2012.
Sources/Usage
Public Domain.