
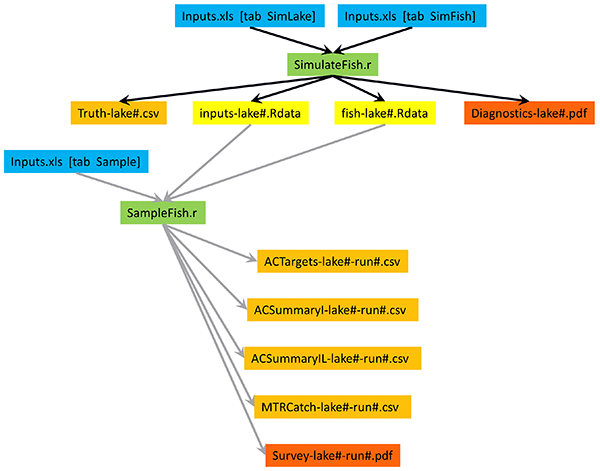
Relationship between artiFISHal inputs, R scripts, and outputs

Detailed Description
This flowchart shows the relationship among program artiFISHal inputs (blue), R scripts (green), and outputs (orange, yellow, and red). Follow the black arrows (top) to create a fish population in a lake. Follow the gray arrows to survey the lake with down-looking acoustics and midwater trawls.