
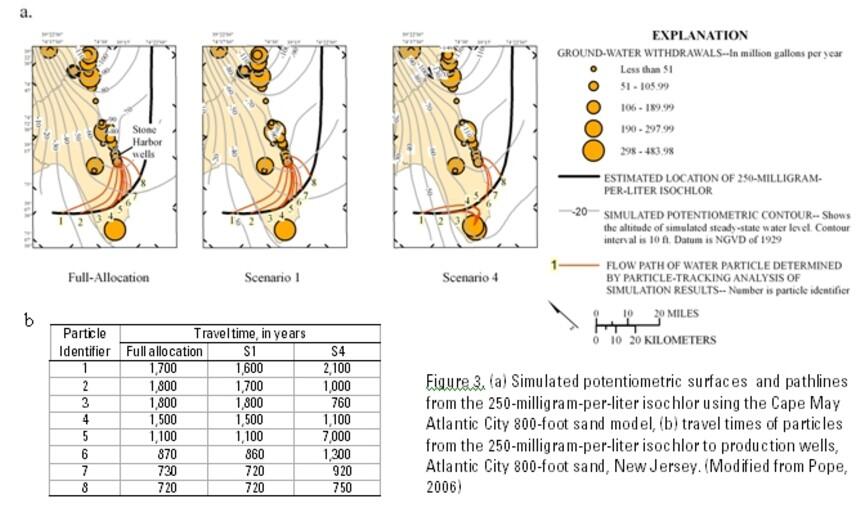
Simulated potentiometric surfaces and pathlines
By New Jersey
Detailed Description
Figure 3.—Simulated potentiometric surfaces and pathlines from the 250-mg/L isochlor using the Cape May Atlantic City 800-foot sand model, (b) travel time of particles from the 250-milligram-per-liter isochlor to production wells, Atlantic City 800-foot sand, New Jersey.
Sources/Usage
Related

Evaluation of Water-Supply Issues
The NJ Coastal Plain RASA (Regional Aquifer System Analysis) model (in this document referred to simply as “the RASA model”) is one of the most widely used models by hydrologists in the NJWSC. This model was developed as part of the RASA program, which was started in 1978 after a congressional mandate to develop quantitative appraisals of the major groundwater systems of the United States.
Related
Evaluation of Water-Supply Issues
The NJ Coastal Plain RASA (Regional Aquifer System Analysis) model (in this document referred to simply as “the RASA model”) is one of the most widely used models by hydrologists in the NJWSC. This model was developed as part of the RASA program, which was started in 1978 after a congressional mandate to develop quantitative appraisals of the major groundwater systems of the United States.