



Snowfall during moderate-to-strong El Nino winters
By Climate Adaptation Science Centers
January 2023 (approx.)

Detailed Description
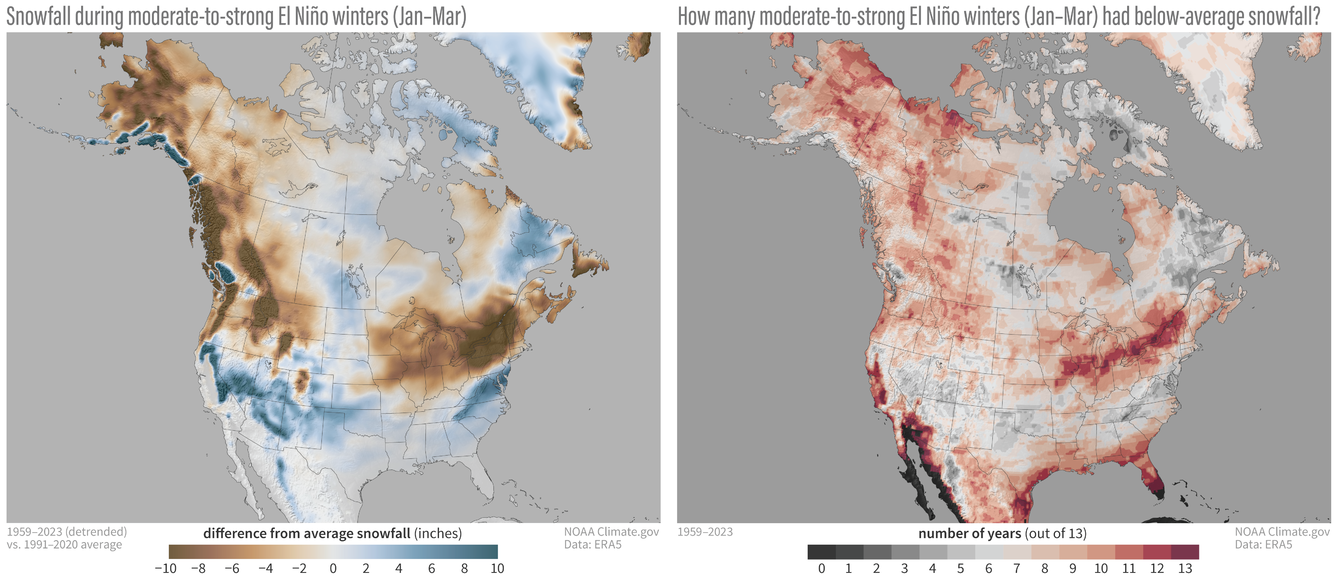
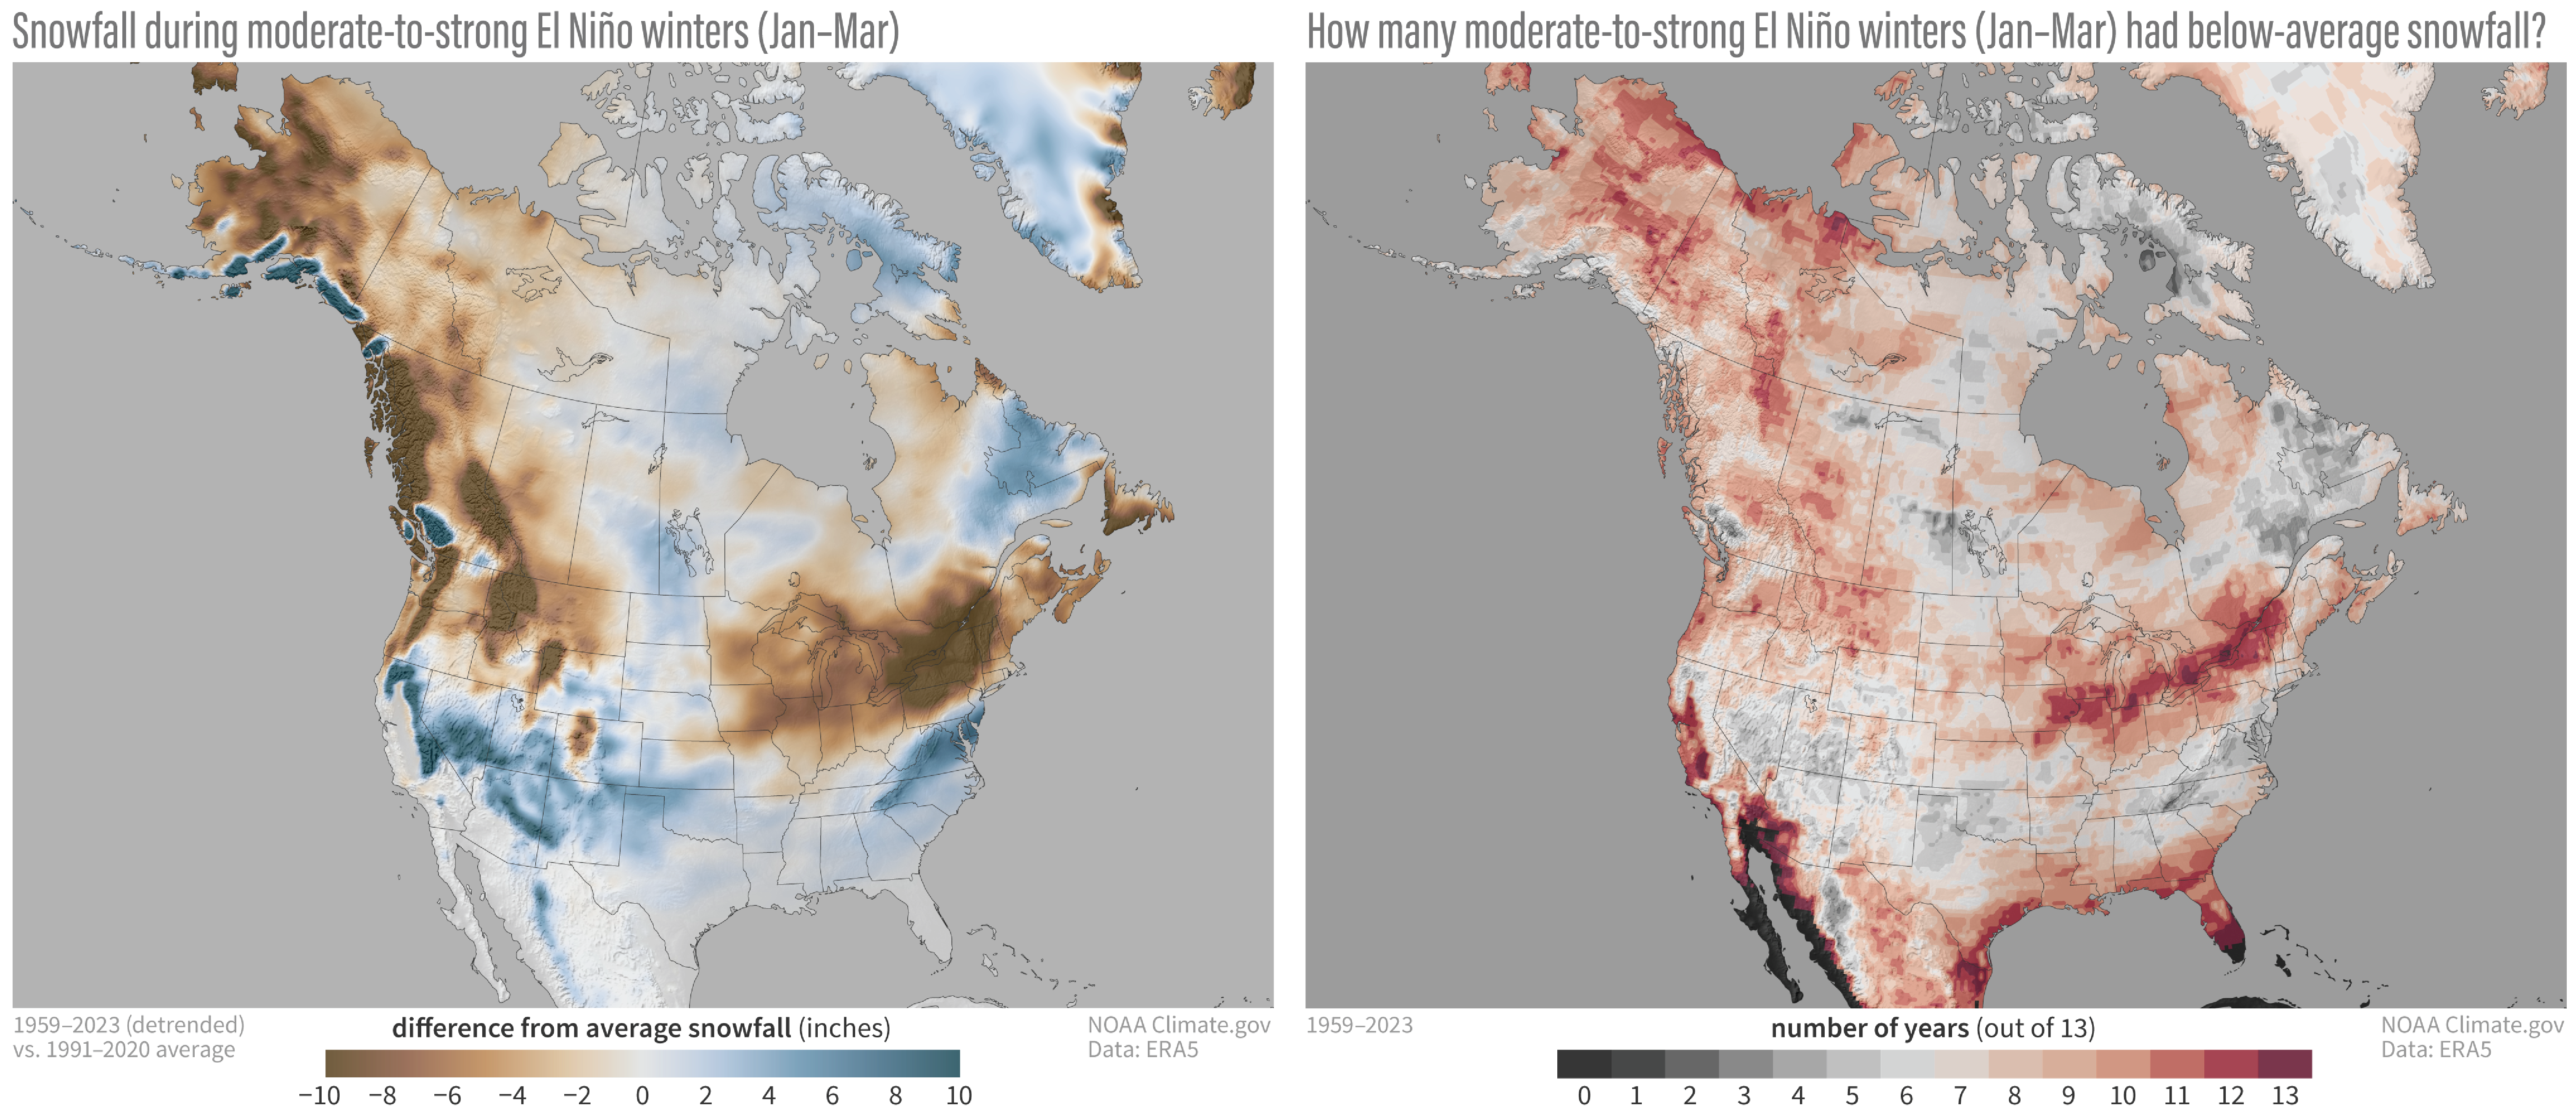
Left: Snowfall during moderate-to-strong El Niño winters (January-March) compared to the 1991-2020 average (after the long-term trend has been removed). Blue colors show more snow than average; brown shows less snow than average. Right: Number of years with below-average snowfall during the 13 moderate-to-strong El Niño winters (January-March average) since 1959. Red shows locations where more than half the years had below-average snowfall; gray areas below-average snowfall less than half the time.
Sources/Usage
Public Domain.
NOAA Climate.gov map, based on ERA5 data from 1959-2023 analyzed by Michelle L'Heureux.