



Southeast US: Total Precipitation Anomaly and Mean Temperature Anomaly, December 2026 - February 2027 Average; as predicted by 6 numerical models


Detailed Description
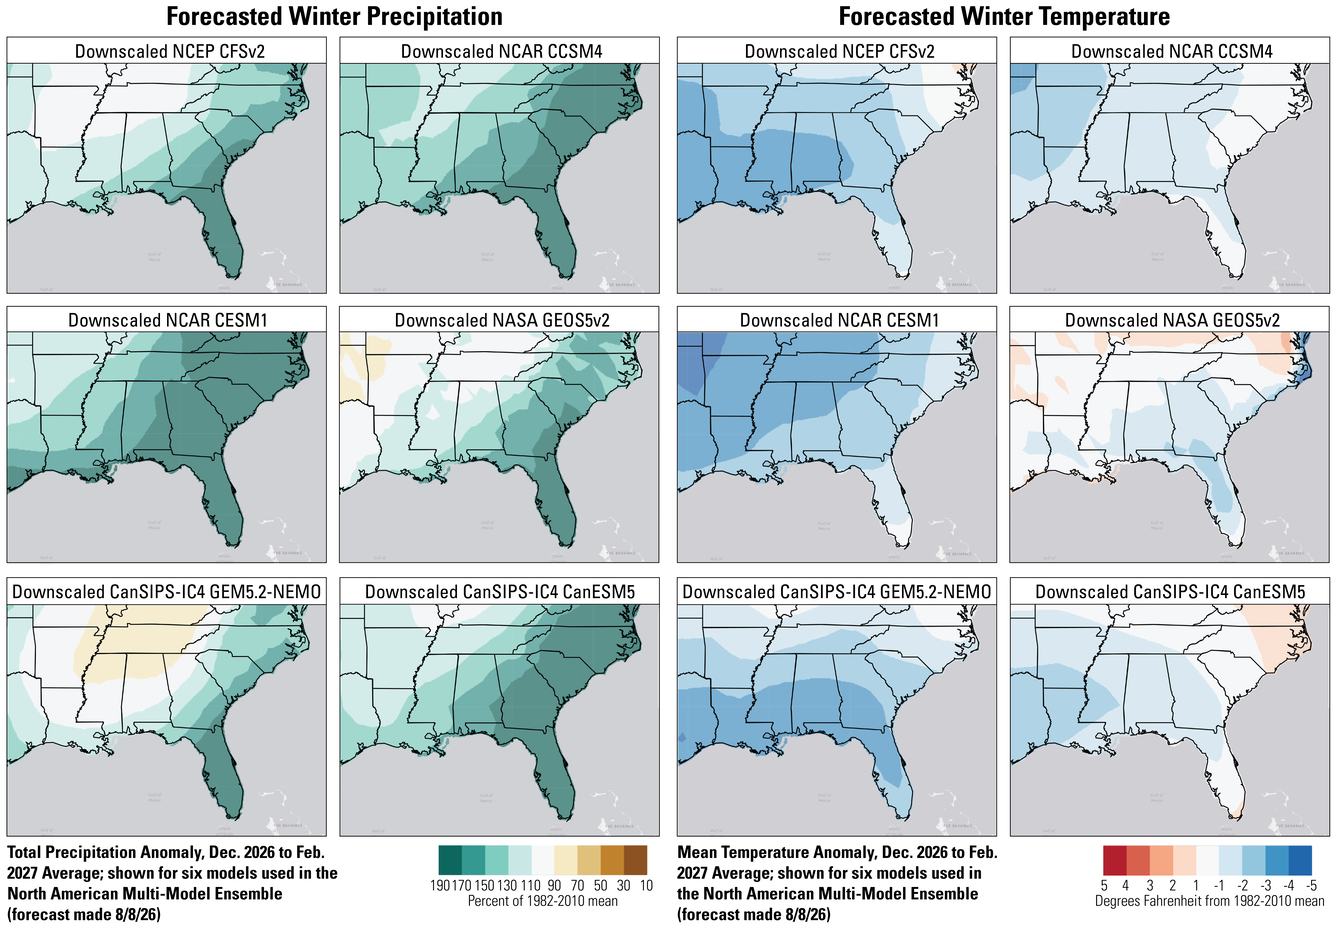
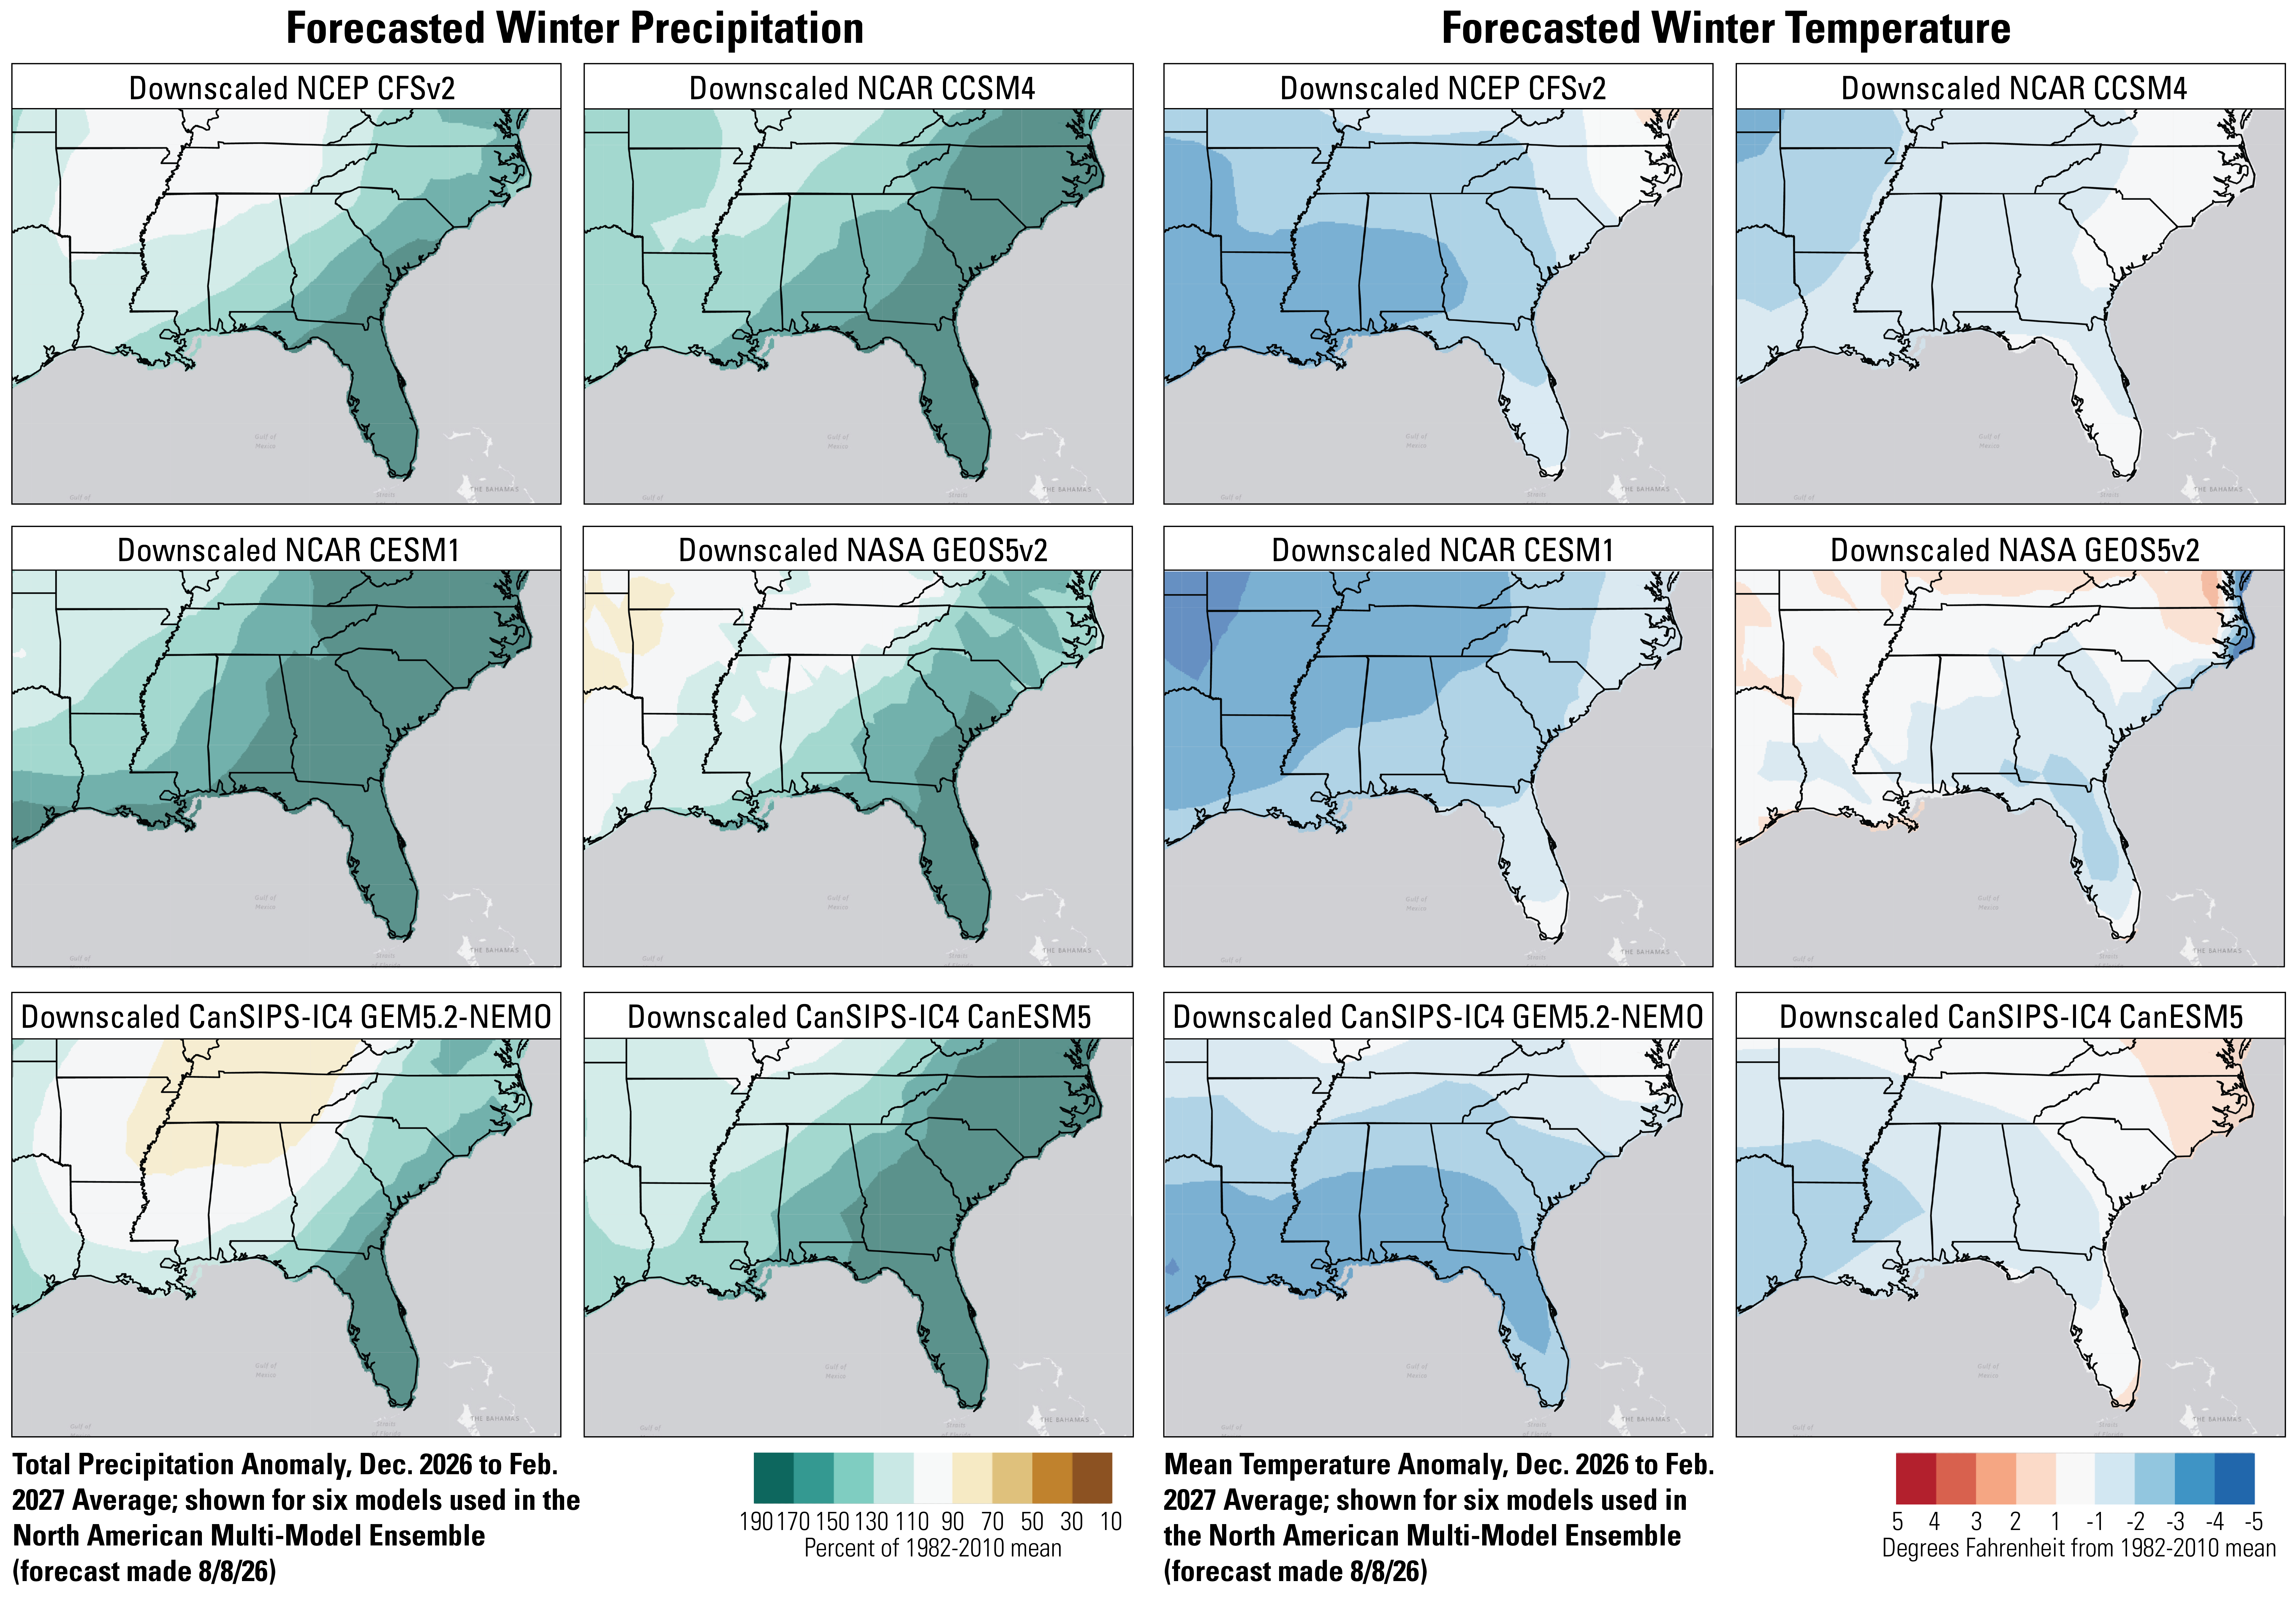
(Left) Percent of the long-term average precipitation as predicted for the southeastern U.S. for winter 2026-2027 by six numerical models used in the North American Multi-Model Ensemble for seasonal forecasting; (Right) Departure from the long-term average temperature as predicted for the southeastern U.S. for winter 2026-2027 by six numerical prediction models used in the North American Multi-Model Ensemble for seasonal forecasting.
Models include:
- Climate Forecast System version 2 (CFSv2) developed by the National Centers for Environmental Prediction (NCEP)
- Community Climate System Model version 4 (CCSM4) developed by the National Center for Atmospheric Research (NCAR)
- Community Earth System Model (CESM1) developed by the National Center for Atmospheric Research (NCAR)
- Goddard Earth Observing System Model version 5 (GEOS5v2) developed by the National Aeronautical and Space Administration (NASA)
- Canadian Seasonal to Interannual Prediction System’s fourth innovation cycle (CanSIPS-IC4) based on the GEM5.2-NEMO model that consisted of the atmospheric component using the Global Environmental Multiscale version 5.2 (GEM5.2) model coupled with the ocean component of Nucleus for European Modeling of the Ocean (NEMO)
- Canadian Seasonal to Interannual Prediction System’s fourth innovation cycle (CanSIPS-IC4) based on the Canadian Earth System Model version 5 (CanESM5).
Data downloaded from https://climatetoolbox.org/tool/Climate-Mapper, University of California-Merced on 8/11/26.
Sources/Usage
Public Domain.