
Stacked area chart plots - Impervious Surfaces

Detailed Description
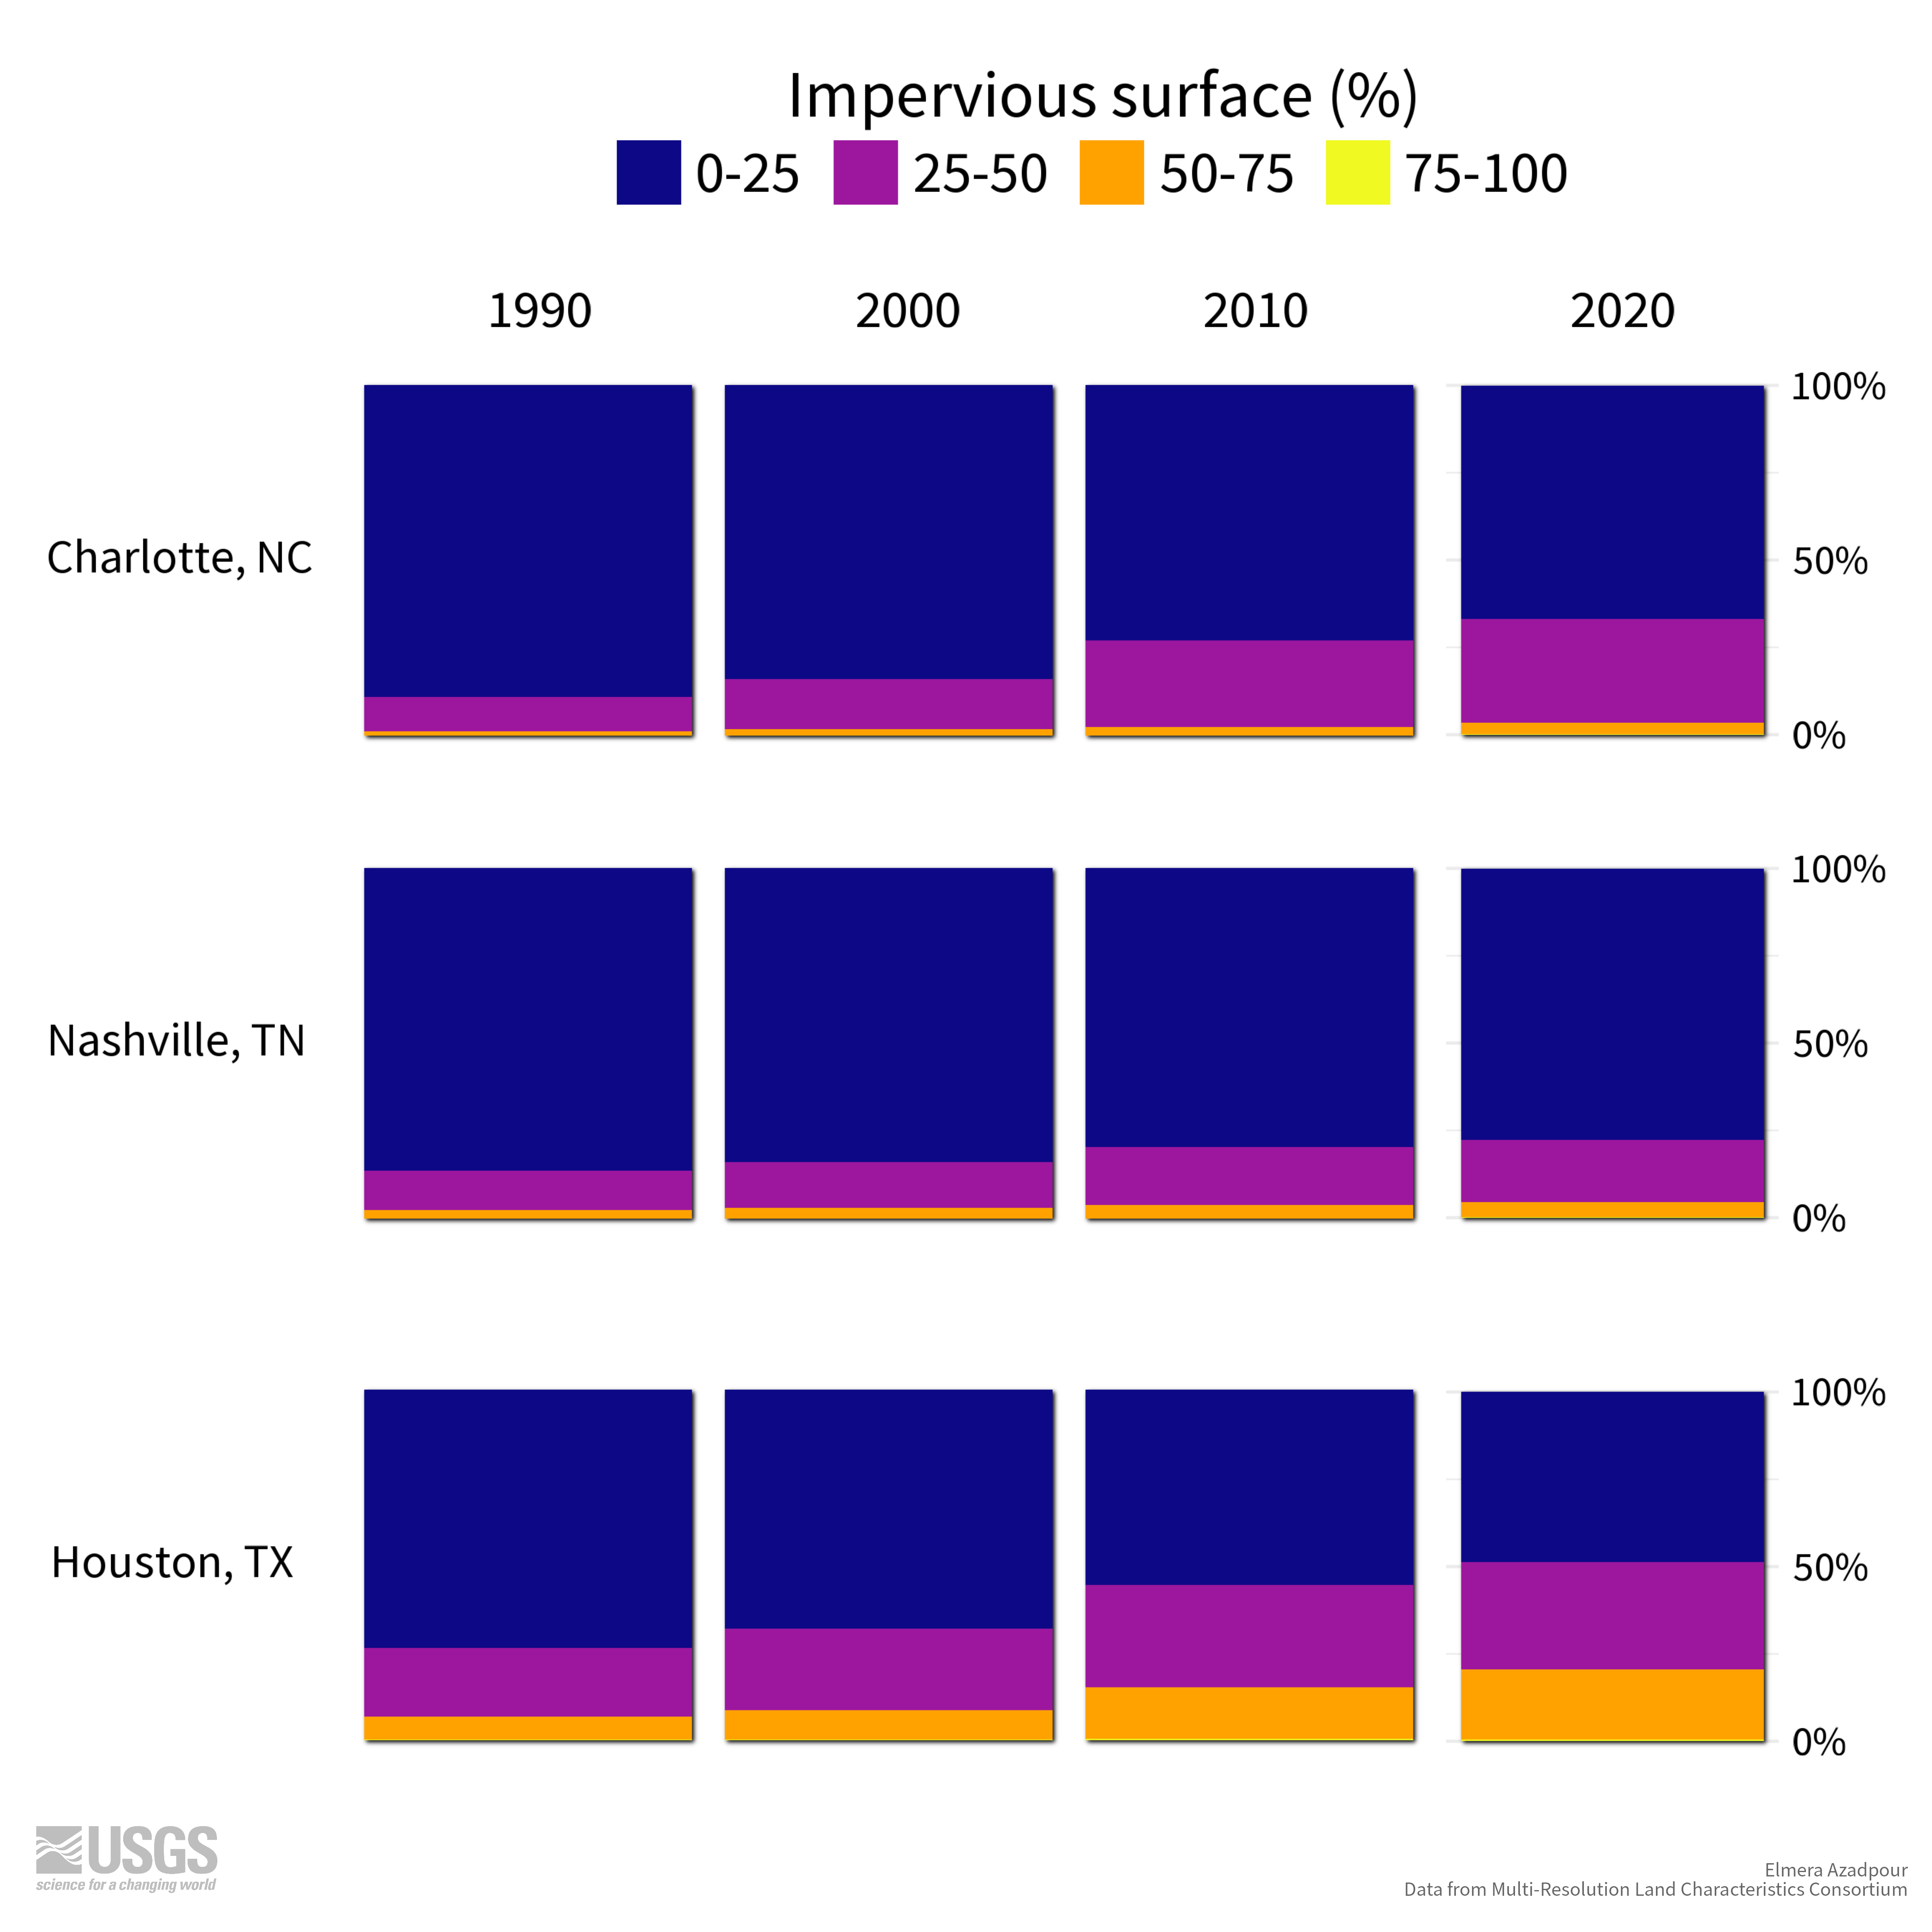
Impervious surfaces, such as highways, streets, pavement, and roofs, are a measurement of urbanization – and also have a big impact on flooding. When it rains on impervious surfaces, water no longer seeps into the ground but runs off into sewers and local waterways. Flooding is too often the result.
Learn more about impervious surfaces and flooding from the Water Science School.
Land cover data available from USGS Sciencebase.
Image: Stacked area chart plots show proportion of impervious surface pixels for Charlotte, NC, Nashville, TN, and Houston, TX from 1990-2020. Blue indicates low impervious surface proportion (0-25%), purple is moderate-low (25-50%), orange is moderate-high (50-75%), and yellow is high imperviousness (75-100%). Charts show increasing intensity of urbanization over time.
Timeseries - Urbanization #30DayChartChallenge
Sources/Usage
Public Domain.