
Surface imagery and subsurface electrical resistivity tomography results from Rosette Spring in Yellowstone’s Lower Geyser Basin

Detailed Description
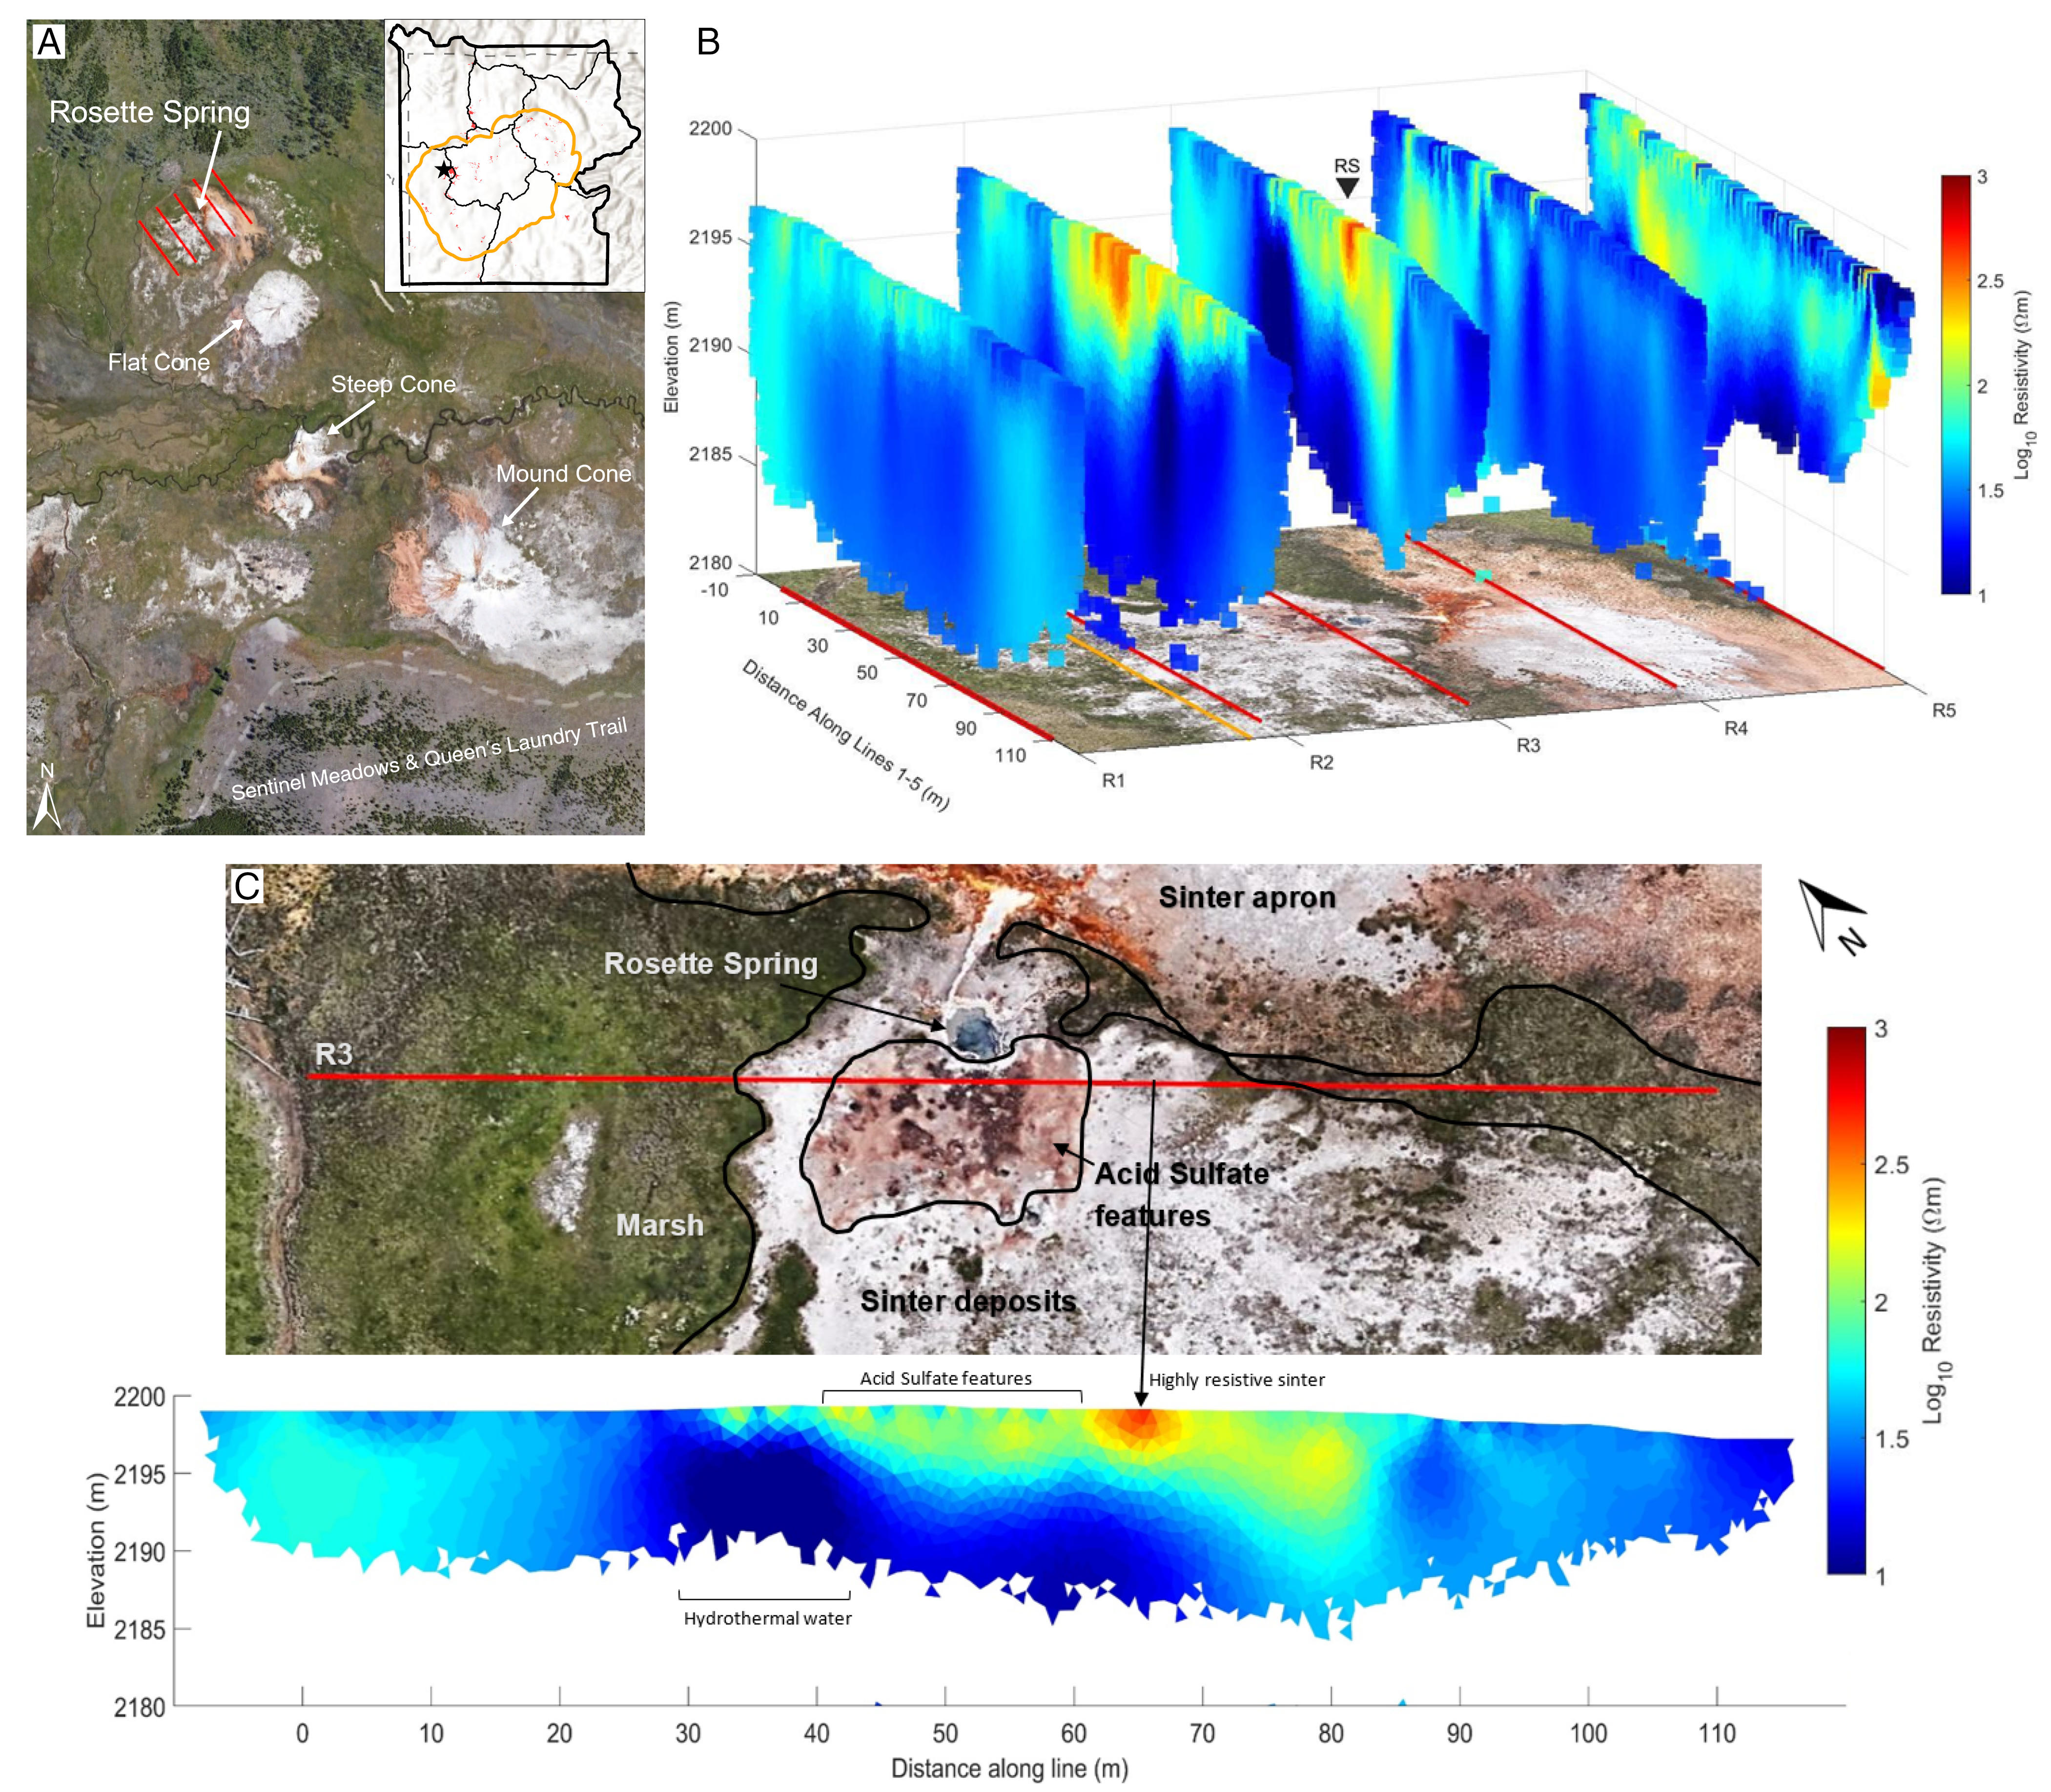
Surface imagery and subsurface electrical resistivity tomography results from Rosette Spring in Yellowstone’s Lower Geyser Basin. A) Site Overview: Google Earth imagery of Sentinel Meadows identifying Rosette Spring, Flat Cone, Steep Cone, and Mound Cone. Red lines denote the five parallel NW-SE electrical resistivity tomography (ERT) survey profiles. B) A three-dimensional fence diagram displaying ERT results in ohm-meters (Ω-m). A logarithmic color scale distinguishes highly resistive features (red) from highly conductive features (blue). C) Cross sectional view of line R3 compared to Google Earth imagery. High-resistivity anomalies (yellow to red) in the near-surface correlate with white sinter deposits on the ground surface. In contrast, the deeper, low-resistivity zone (dark blue) is interpreted as hydrothermal water that feeds Rosette Spring. Figure by Natalie Carter, Wyoming State Geological Survey.
Sources/Usage
Public Domain.