
Surface water maps derived from Landsat 30-m imagery
By Western Geographic Science Center
2019 (approx.)
Detailed Description
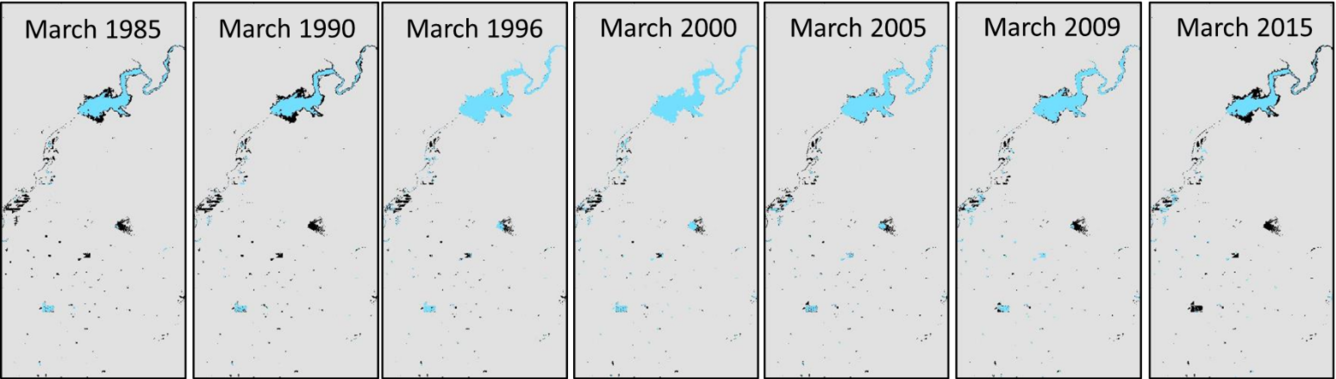
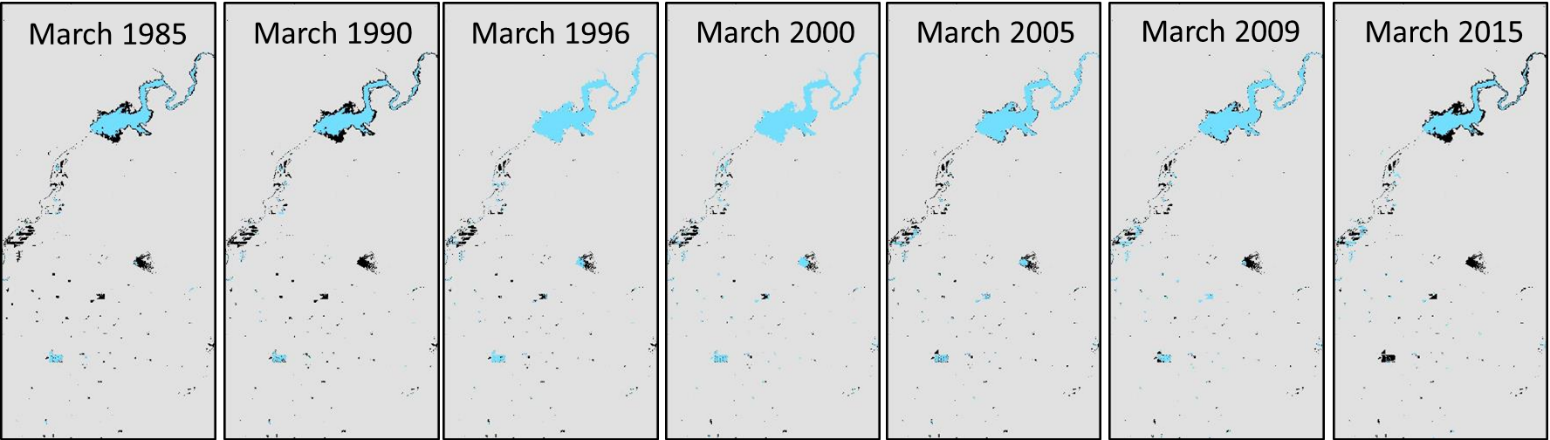
Diagram illustrating surface water fluctuations using select March snapshots of Friant Dam outside of Fresno, CA (black background represents March maximum water extent across 31 years.
Sources/Usage
Public Domain.