



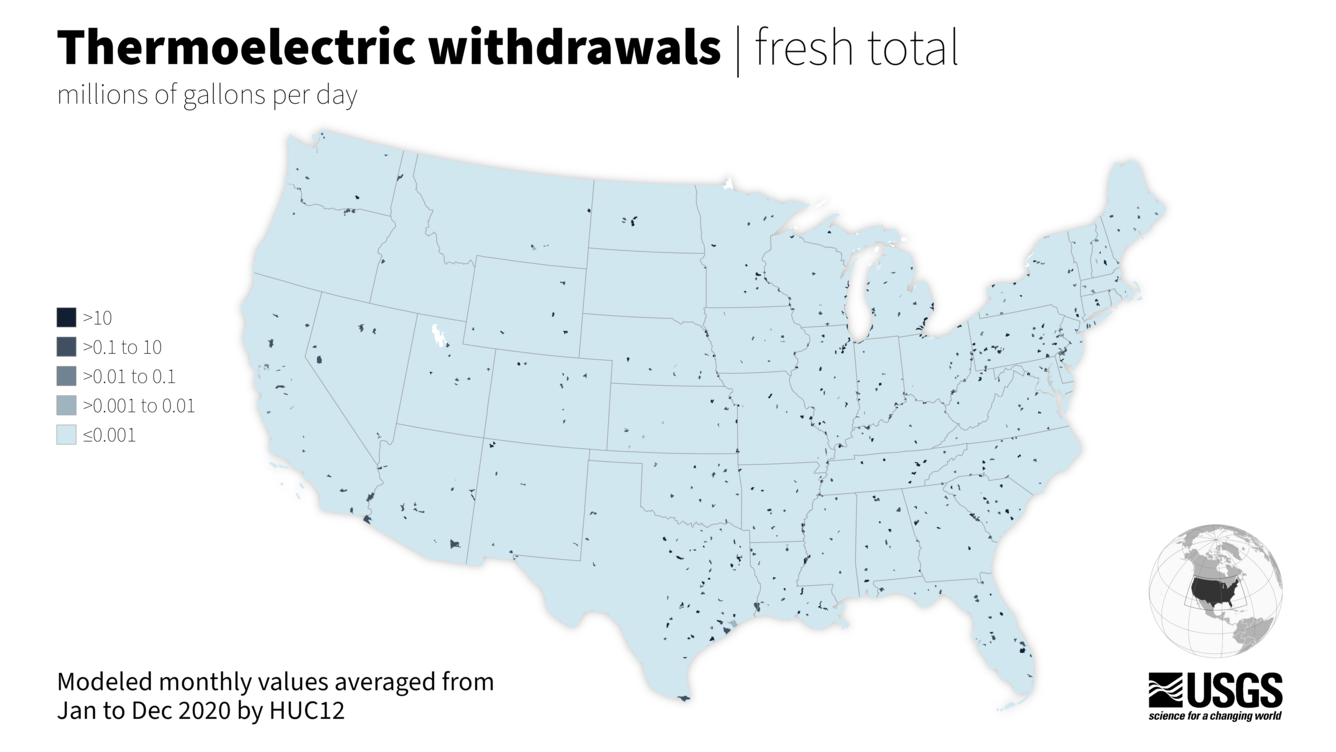
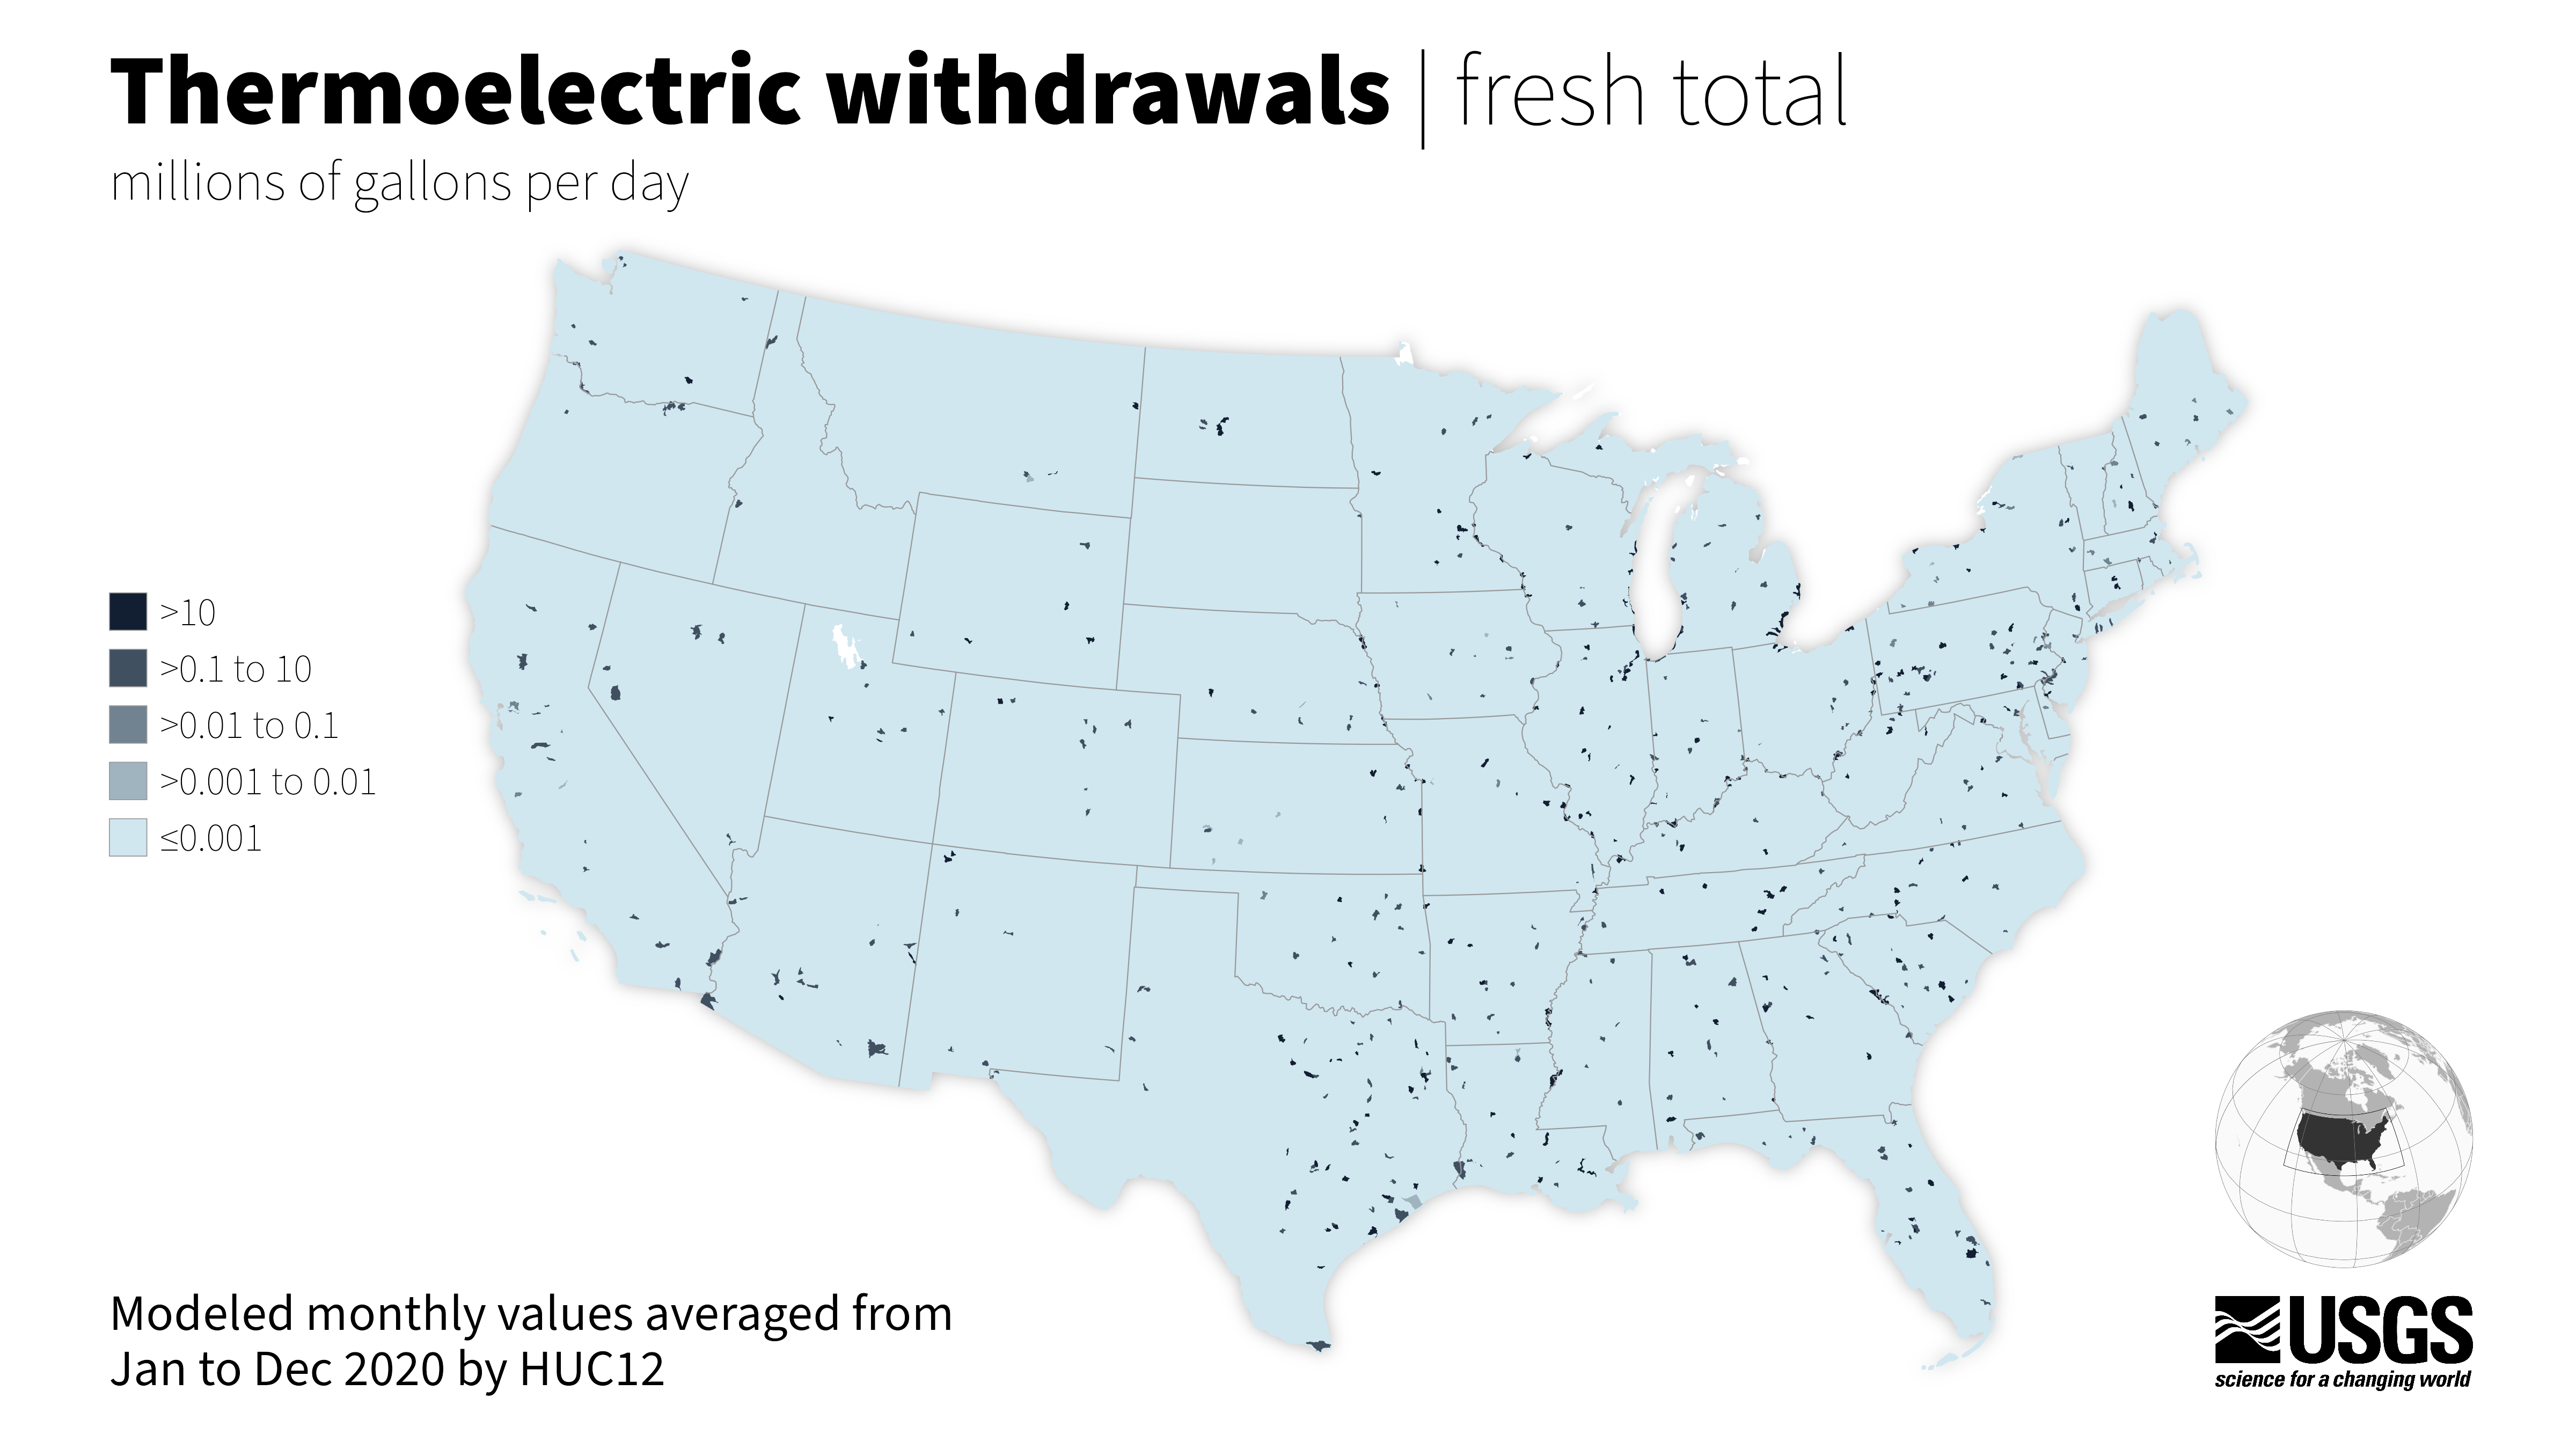
Thermoelectric Power Water Use map, monthly averages 2020 by watershed


Detailed Description
This model computes the amount of water withdrawn and consumed by thermoelectric power plants each month in calendar year 2020 for all subwatersheds (12-digit Hydrologic Unit Codes or HUC12s) in the lower 48 United States.
Thermoelectric power plants withdraw more water than any other sector of water use in the United States. In this model, the amount of water that is withdrawn and consumed by thermoelectric power plants is computed based on linked heat-and-water budgets, accounting for power plant generation and cooling system technologies, the quantity of fuels consumed and electricity generated, and environmental factors such as air temperatures, water temperatures, wind speed, and elevation.
Published through the National Water Availability Assessment Data Companion.
Sources/Usage
Public Domain.