



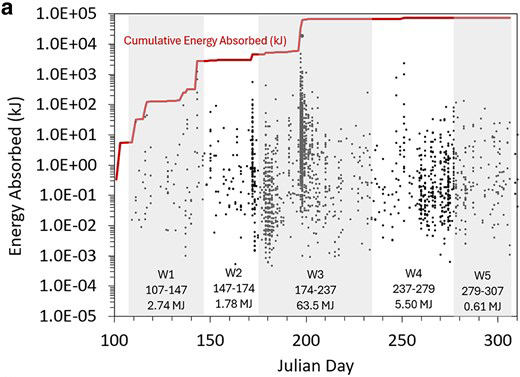
Total energy absorbed from Yellowstone earthquakes during May to November 2021


Detailed Description
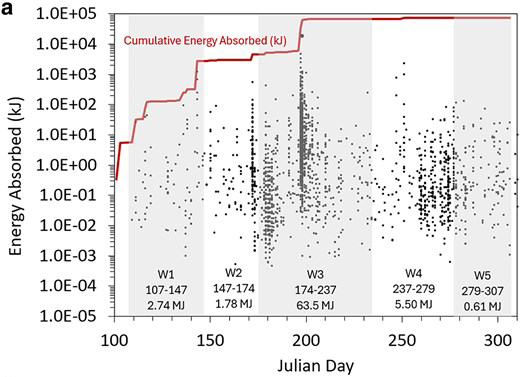
Plot showing total energy absorbed from earthquakes throughout the May to November 2021 sampling period of a microbial study in Yellowstone National Park. The five different sampling windows are distinguished by shading, and Julian Day is the number of the day within the year (so Julian Day 200, for example, was July 19, 2021). Dots correspond to individual earthquakes, with higher-magnitude events towards the top and lower towards the bottom. The Cumulative Energy Absorbed (red line) increased in a series of jumps, with particularly large jumps corresponding to strong earthquakes and earthquake swarms in May–June (around Julian day 140) and July (around Julian day 200). Seismic activity had significantly diminished by the end of the sampling period, causing the Cumulative Energy Absorbed to plateau. Adapted from Boyd et al., 2025 (https://doi.org/10.1093/pnasnexus/pgaf344).
Sources/Usage
Public Domain.