
Vulnerability Map

Detailed Description
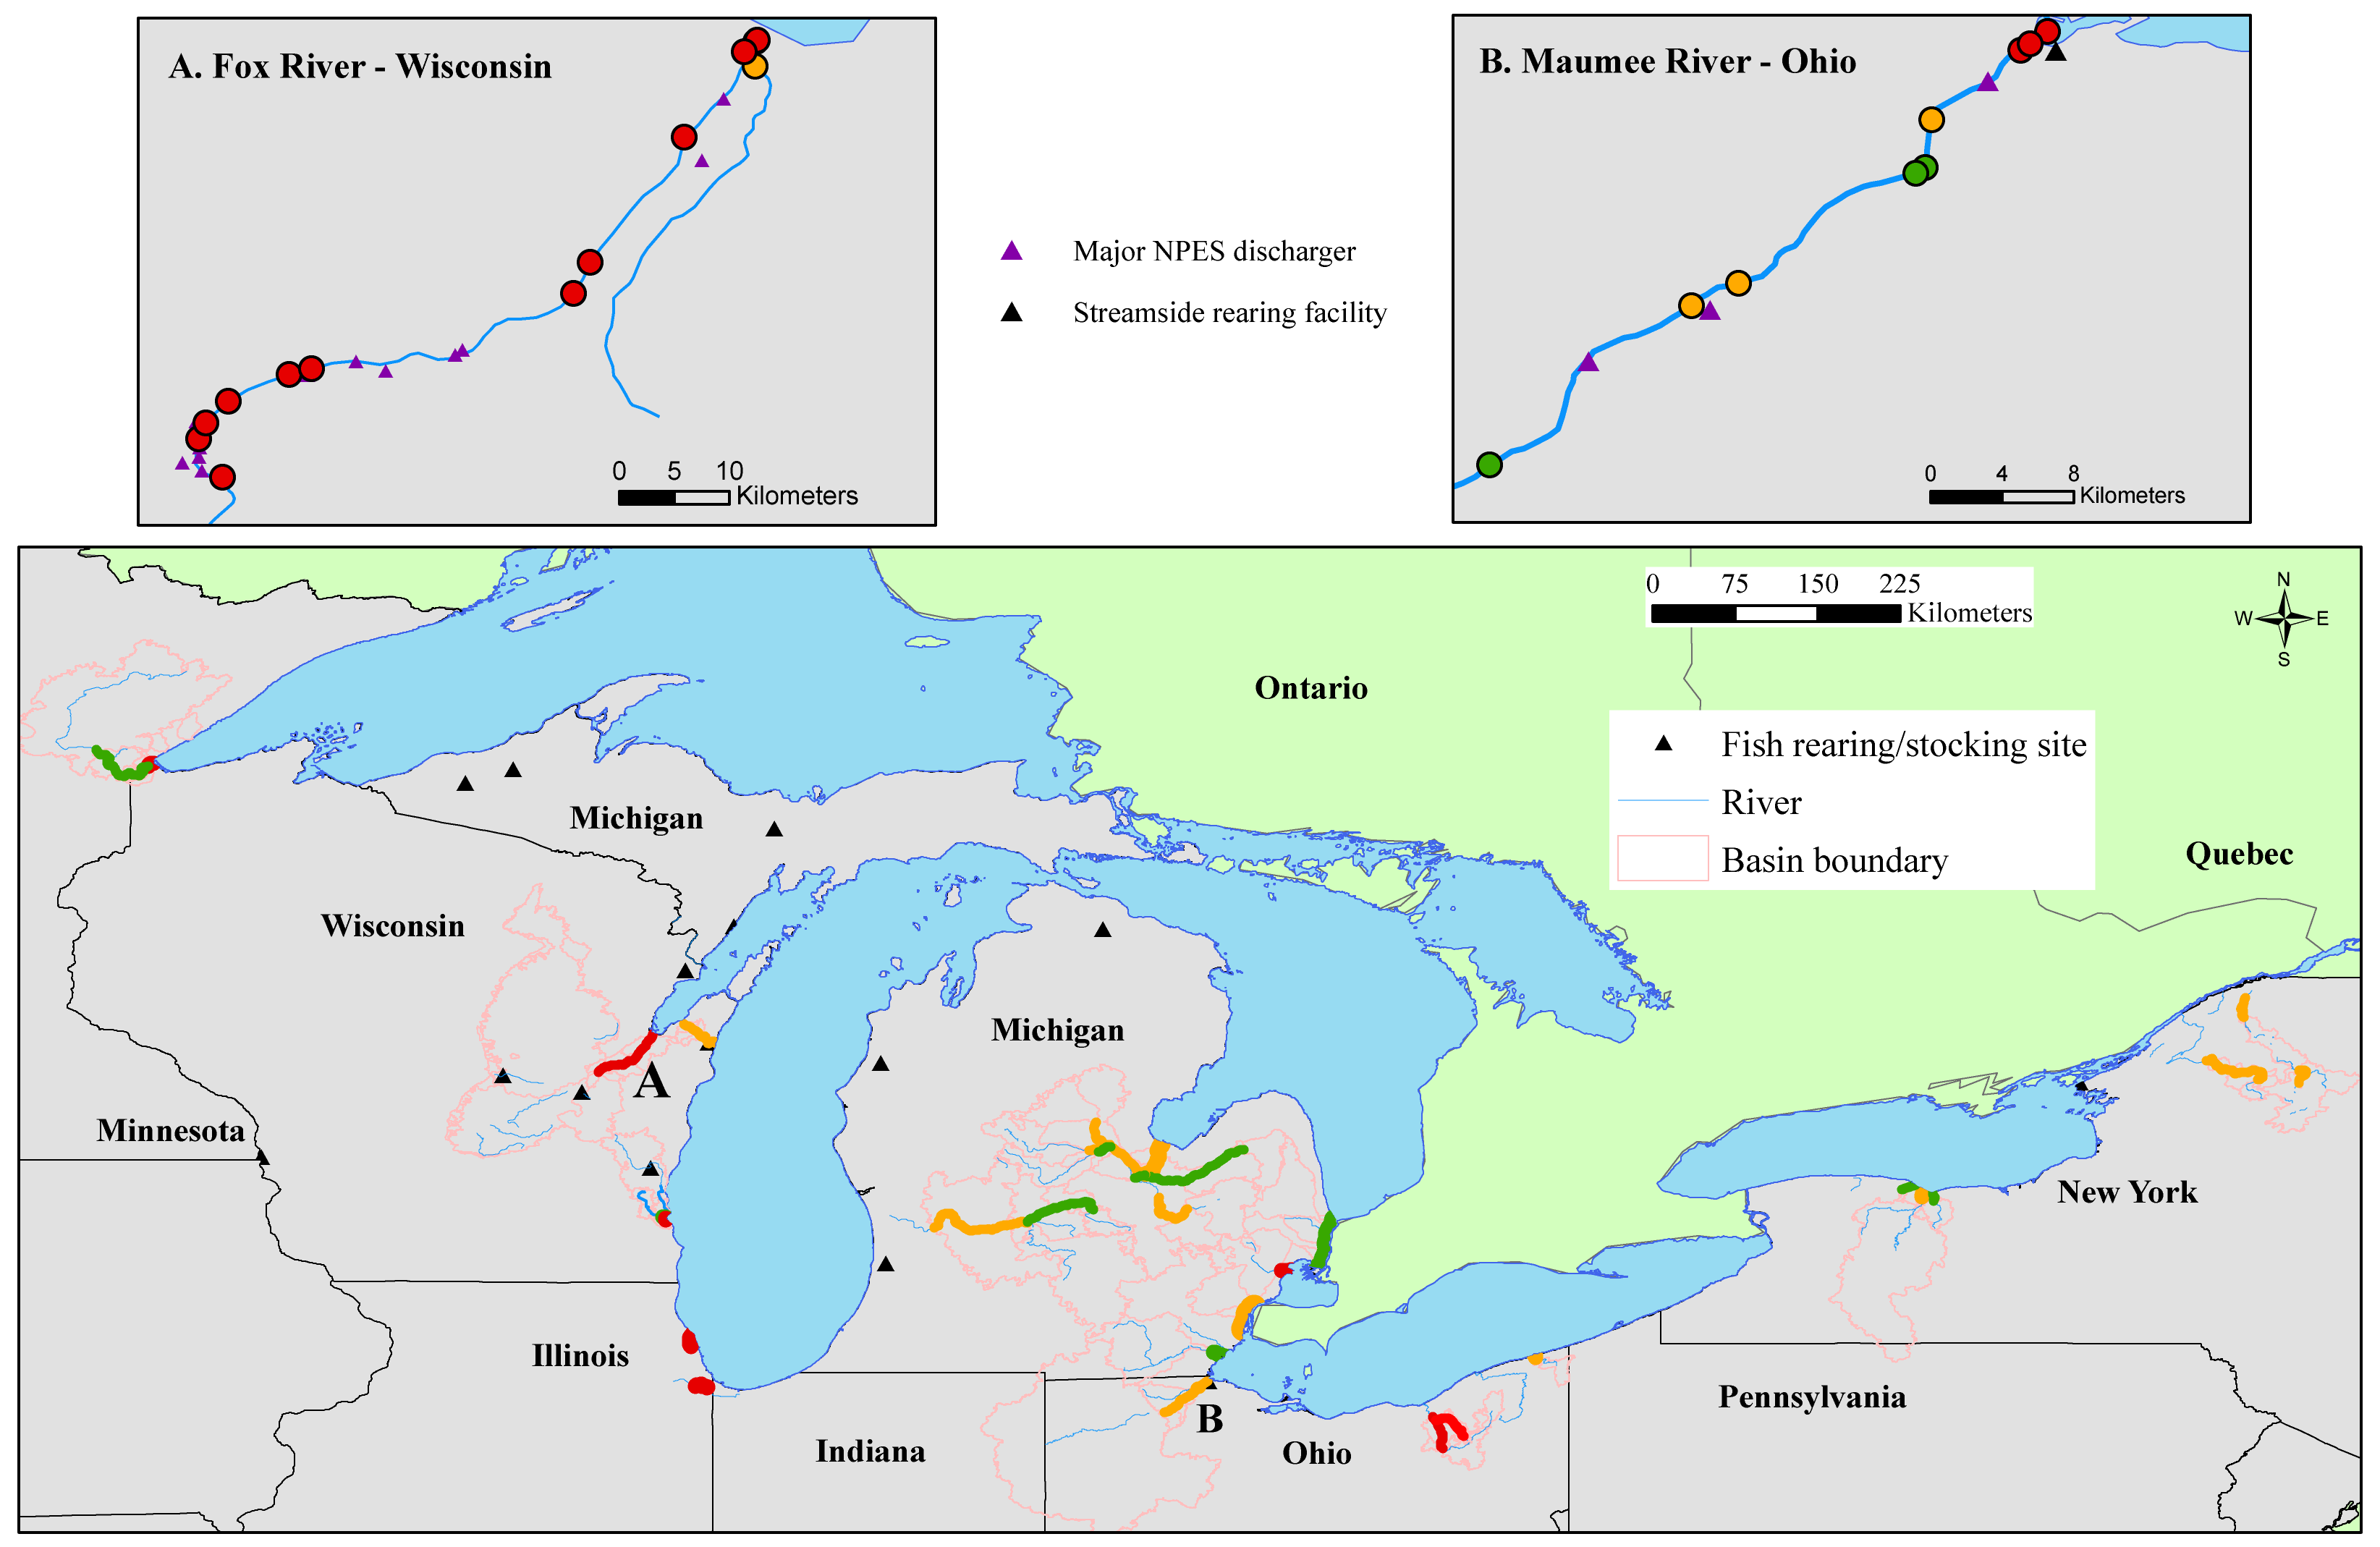
Map displays vulnerability of sampled streams to CEC class occurrence with low vulnerability in green, medium in orange, and high in red. Inset maps A and B display vulnerability for specific sampling locations on two frequently sampled streams.
Sources/Usage
Credit: USGS