
Decades of measuring glaciers: A USGS legacy
This article is part of the Spring 2015 issue of the Earth Science Matters Newsletter.
Overview: Glaciers are large, persistent masses of ice that move slowly across the land surface under their own weight and are influenced by changes in temperature and precipitation. Their response to those changes have impacts on physical, biological, and social systems, because glacier changes affect water availability and quality, sea level, and ocean circulation systems.
Large polar ice sheets (i.e. Antarctica and Greenland) contain most of the planet’s land ice. However, it is the smaller alpine glaciers found in mountains (Figure 1) that have shown the most rapid response to recent climate change, have the most immediate impact on human water supplies, and have, thus far, contributed the most to sea level rise (Meier et al., 2007; Gardner et al., 2013). Documenting how these alpine glaciers are affected by climate change is helping us to better understand how glacier change affects ecosystems and resources. Additionally, this research will improve the accuracy of estimates of future glacier change that can guide decision-makers and stakeholders.

Today, nearly all Earth’s alpine glaciers are losing ice (Gardner et al., 2013). Shrinking glaciers are often the most visible indicators of mountain ecosystems responding to climate change. Notably, rates of mass loss for North American glaciers are among the highest on Earth. North American glacier shrinkage impacts downstream hydrological networks by changing the total discharge, flow regime, and chemistry of rivers and oceans. The USGS is actively involved in measuring these glacier changes. Its research efforts in this regard are critical to understanding and adapting to the ecosystem shifts driven by climate change.
Measuring glacier change: Resolving the relationship between climate change and glacier length and thickness is accomplished through mass balance investigations – the snow and ice accounting system for glaciers. Traditionally, determining whether a glacier is gaining or losing mass involves measuring the change in mass at specific sites with snow stakes and snow pits (Figure 2), and then extrapolating these point values over the entire glacier surface. Measurements are generally made twice annually to determine seasonal mass gains and losses as well as the net change over the entire year.
Recent technological advances in remote sensing provide new opportunities to quantify how glaciers are changing. Image- and radar-based Digital Elevation Models (DEMs) provide 3D representation of a glacier’s surface (Figure 3), with meter-scale precision. DEMs allow field measurements to be extrapolated over the entire glacier. Moreover, repeat acquisitions over several years can be compared to determine total volume change of the glacier, which can be used to improve traditional stake and pit estimates of long-term mass balance trends.
Glaciers are made of several materials with different densities (given in units of kg m-2): snow that fell in the most recent winter (200-500 kg m-2 ), firn (snow from previous winters, 500-900 kg m-2 ) and ice (900 kg m-2). Because of these highly variable densities, average mass balance estimates for a glacier are presented in water-equivalent (w.e.) units. In this system, the densities and thicknesses of snow, firn and ice layers are first converted to water equivalent units. Then changes in mass balance are represented as a uniform water equivalent thickness over the entire glacier area.


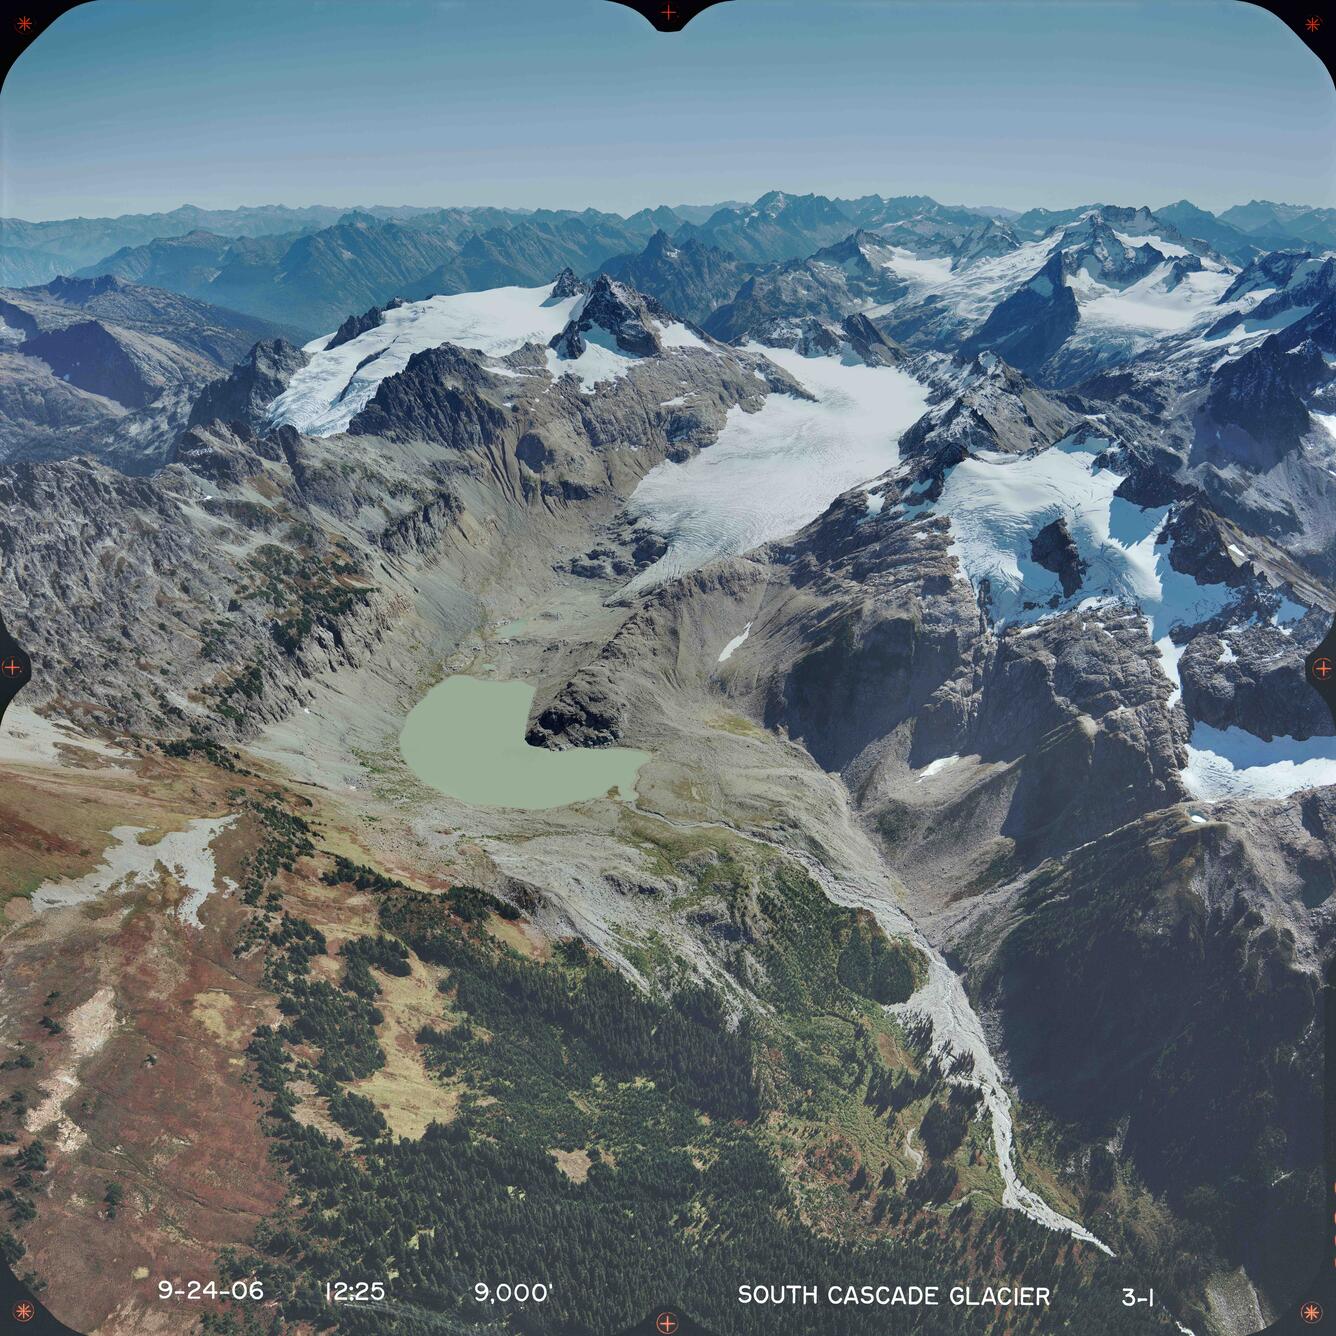
Unified USGS Glaciology: Since the late 1950s, USGS has maintained a glacier mass-balance program at three North American glaciers. These ‘Benchmark Glaciers’ include Washington’s South Cascade Glacier, and Alaska’s Gulkana and Wolverine glaciers (Fig. 4). Results from this program form the longest continuous record of North American glacier mass balance. Similar measurements began at Sperry Glacier, Montana in 2005.
In 2013, research at these independent sites was unified into a single project, with an ultimate goal of measuring changes in glacier mass across the principal North American climate zones that support them. Common field and analysis methodologies will enable comparison among the glaciers, and provide an improved understanding of both the causes and magnitudes of glacier change over long time periods at a continental scale.
Each benchmark glacier is influenced by a unique climatology. In Alaska, the measurements capture changes in both continental and maritime climate zones. Alaska’s maritime climate zone is characterized by relatively warm and wet weather while the continental climate zone is characterized by extreme winter cold, warm or even hot summers, and substantially less precipitation than along the coast. Washington’s maritime climate zone includes some the highest precipitation recorded for the lower 48 states of the United States. Montana’s Intermountain climate zone reflects a blend of maritime influences from the west and continental influence from the Arctic and Great Plains, which meet along the continental divide.
Currently, historic data from the benchmark glaciers is being reanalyzed with consistent analysis techniques across the four glaciers. An emphasis on generalized algorithm development will allow other mass balance programs to be analyzed using the same algorithms (e.g., Taku Glacier in Alaska).
The fully unified USGS Benchmark Glacier project will allow mass balance records from different parts of North America to be directly compared to better understand the response of glaciers to climate changes. The two Alaskan benchmark glaciers have already undergone this comparative reanalysis, which revealed differences in variability and trends between the coastal and continental glaciers (O’Neel et al., 2014). For example, Figure 5 shows short-lived mass gains (positive slopes) at Wolverine Glacier; in the 1980’s the cumulative mass balance indicates gains since the 60s (positive values). These episodes of growth result from the abundant snow accumulation and cool summers that characterize Alaska’s coastal climate zones. In contrast, the persistent mass loss at Gulkana glacier exemplifies the stronger dependence of continental glacier mass balance on summer temperature.

Additionally, as traditional field measurements are combined with remote sensing data, the short-lived remote sensing records can be linked to the longer field records. Just as geodesists have linked the tide gauge and satellite records to better understand sea level rise, glaciologists aim to link field and satellite records to gain regional insight into changing glaciers.
Implications of glacier change: Although the total volume of mountain glacier ice is small compared to the polar ice sheets, the aggregate mass loss is contributing to sea level rise at rates similar to those of the ice sheets. Much of the melt water is delivered into rivers and has direct impacts on surrounding populations through changes in water quality and availability.
Glacier runoff also links the physical and biological components of ice-covered ecosystems. Meltwater has a pronounced impact on the physical properties of rivers and streams, affecting temperature, nutrients, and turbidity, which in turn control the structure and biodiversity of downstream ecosystems.
As we work toward understanding the complex relationship between glaciers and the climate system, the degree to which biophysical linkages permeate glacier-covered ecosystems is increasingly evident. The broad scientific approach being undertaken by the USGS is beginning to resolve these uncertainties, in ways that identify regional trends in mountain glaciers and their environments, including changes to streamflow, ecosystem function, oceanic circulation patterns, and contributions to global sea level.
Further Reading:
Arendt, A., S. Luthcke, A. Gardner, S. O’neel, D. Hill, G. Moholdt, and W. Abdalati, 2013, Analysis of a GRACE global mascon solution for Gulf of Alaska glaciers, Journal of Glaciology, Vol.59, no. 217, p. 913–924, doi: 10.3189/2013JoG12J197.
Gardner, Alex S., et al., 2013, A Reconciled Estimate of Glacier Contributions to Sea Level Rise: 2003 to 2009, Science, Vol. 340, p. 852-7. DOI: 10.1126/science.1234532.
Meier, Mark. F., et al., 2007, Glaciers Dominate Eustatic Sea-Level Rise in the 21st Century, Science, Vol.317, no.5841, p.1064-7. DOI: 10.1126/science.1143906.
O’Neel, S., E. Hood, A. Arendt, and L. Sass, 2014, Assessing streamflow sensitivity to variations in glacier mass balance, Climatic Change, Vol.123, no. 2, p.329-341. doi: 10.1007/s10584-013-1042-7.