



Volcano Watch — Such great heights: measuring Kīlauea’s lava fountains
“How tall is the fountain?”
This is the question that volcano watchers keep coming back to once the lava fountains start at Kīlauea. And there have been plenty of opportunities to ask this, as we’ve now had 56 lava fountains over the past two years at the summit of Kīlauea.
Volcano Watch is a weekly article and activity update written by U.S. Geological Survey Hawaiian Volcano Observatory scientists and affiliates.
Some of these fountains have peaked fairly low (a little over 100 yards or 91 meters) but some have been absolutely towering (over 500 yards or 457 meters). So how do USGS Hawaiian Volcano Observatory (HVO) geologists actually measure the fountain height?
There are actually two sets of measurements. First, there are the real-time estimates that are put in the status reports and daily updates. Second, there are the more detailed and accurate measurements calculated later on that are meant for scientific analysis.
The first set of measurements are done in real-time from the webcams. During the course of a fountaining episode, HVO scientists will monitor webcams like the K2cam, at Uēkahuna bluff. We use an overlay on the image with an approximate scale based on the camera’s field of view and distance to the vent.
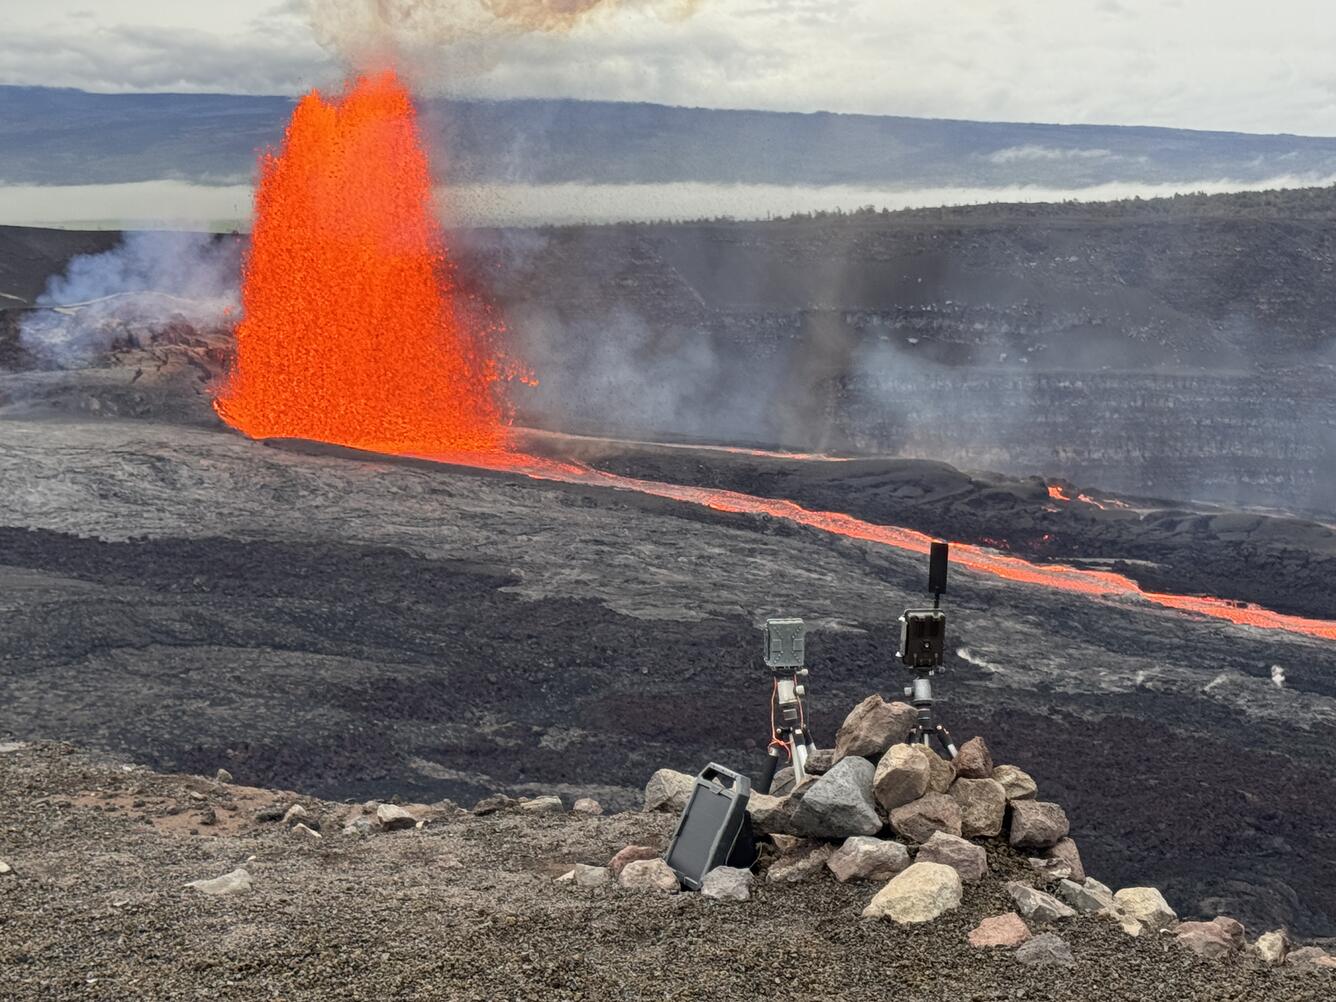
The second set of measurements is a bit more time consuming. Once the fountaining episode has ended, HVO geologists hike out to the caldera rim to swap data cards on a network of timelapse cameras. These cameras run 24/7, and capture one image per minute onto their internal data cards.
Timelapse cameras aren’t a new tool at HVO. They were used extensively in the 1980s to track the height of fountains at Puʻuʻōʻō, and in those days the images were stored on film that had to be developed. Since then, HVO geologists and field engineers have been improving the timelapse systems, developing home-grown solutions and testing many different off-the-shelf models. Today, we use compact digital cameras that store tens of thousands of images onto a small data card.
These timelapse cameras have a fixed lens (no zoom) so their field of view is stable, which makes quantitative measurements from the images much simpler and less prone to error. To measure the exact field of view that the camera captures, we do measurements in the lab first. This entails capturing images of a checkerboard calibration grid from various angles, and feeding these images into software that calculates the precise field of view and the amount of lens distortion.
The timelapse images from the field are first culled to just the fountaining episode, and brought into another piece of software that allows us to manually track features in a sequence of images and record pixel coordinates. HVO geologists go through the images one by one and manually click at the top of the fountain. A long list of pixel coordinates of the fountain top is then recorded, which might take an hour or so for 500-800 images. Subtracting the pixel coordinates of the vent produces a height of the fountain in units of image pixels.
To get the fountain height in yards or meters, you then need to know the size of the pixel footprint. This can be calculated using two pieces of information. First, there is the camera field of view from the lab measurements described above. Second is the distance between the camera and the vent, which is easy to determine from GPS coordinates and our aerial mapping of the vent complex.
Note that the measurements are made to the top of the continuous fountain body—basically the portion that completely blocks the view to the other side. Above the fountain body there is a span of discontinuous incandescent particles, but these aren’t included in the height. So the measurement is a bit more conservative than what many people might estimate, as the human eye might naturally include some of those incandescent particles in the fountain height.
Could automated tools like AI or machine learning be used to speed up the measurements? Yes, possibly. But the top of the fountain is often subjective, or sometimes obscured, so it is a harder problem than it might seem at first. Right now, manual measurements are the most trusted, but applying AI to imagery like this is an ongoing project.
As long as the eruption persists, HVO will continue to measure and monitor it. These fountain height measurements for the first 50 episodes have been compiled into a data release that was just published recently, and this is free to the public:
Patrick, M.R., and Adams, R.G., 2026, Lava fountain heights and associated timelapse images for the summit eruption of Kīlauea volcano, Island of Hawaiʻi, 2024-2026 (continuing): U.S. Geological Survey data release, https://doi.org/10.5066/P14MLKCX.
Volcano Activity Updates
Kīlauea has been erupting episodically within the summit caldera since December 23, 2024. Its USGS Volcano Alert level is WATCH.
Episode 56 of lava fountaining in Halema'uma'u at the summit of Kīlauea began at 12:10 p.m. HST on November 5, 2026, and is ongoing as of this publication. The summit region switched from inflation to deflationary tilt at the start of fountaining. Summit sulfur dioxide emissions are elevated. Ground-level sensors near the eruptive vents indicate that winds are blowing from the northeast direction, which suggests that volcanic gas emissions and volcanic material may be distributed to the southwest direction from Halemaʻumaʻu. No unusual activity has been noted along Kīlauea’s East Rift Zone or Southwest Rift Zone.
Mauna Loa is not erupting. Its USGS Volcano Alert Level is at NORMAL.
No earthquakes were reported felt in the Hawaiian Islands during the past week.
HVO continues to closely monitor Kīlauea and Mauna Loa.
Please visit HVO’s website for past Volcano Watch articles, Kīlauea and Mauna Loa updates, volcano photos, maps, recent earthquake information, and more. Email questions to askHVO@usgs.gov.
Related

Volcano Minute — How tall is that fountain? Volcano Minute — How tall is that fountain?
Related