
Can a geological thermometer help forecast hydrothermal explosions in Yellowstone?
Hydrothermal explosions are notoriously hard to predict. But a geological thermometer based on hot spring chemistry might help.
Yellowstone Caldera Chronicles is a weekly column written by scientists and collaborators of the Yellowstone Volcano Observatory. This week's contribution is from Pat Shanks, emeritus research geologist with the U.S. Geological Survey.

Yellowstone is home to the world’s largest-known hydrothermal explosions, including Mary Bay, Turbid Lake, and Elliott’s Crater on the north side of Yellowstone Lake, and Pocket Basin and Twin Buttes in Lower Geyser Basin. Numerous studies have focused attention on these geologic hazards, and especially the processes that may trigger or control them. A small but hazardous explosion of Black Diamond Pool in the Biscuit Basin thermal area in 2024 destroyed part of the boardwalk, ejected many large rock fragments, and required park visitors to quickly flee the area, providing a demonstration of the power and potential danger of even a geologically minor event.
An important goal of research on hydrothermal explosions is to identify the geologic, geophysical, or geochemical signals that might allow them to be forecast in advance.
Geologic observations provide evidence of the framework for how an explosive event occurred, its timing and evolution, and whether it was related to other events like earthquakes or changes in thermal activity.
Geophysical techniques that are best suited for detecting hydrothermal explosions are seismic and infrasound monitoring. These tools identified smaller eruptions in the Biscuit Basin area after the 2024 explosion, as well as a small hydrothermal explosion in Norris Geyser Basin in April 2024.

But what about geochemical monitoring, which involves using the chemical composition of hot spring fluids to calculate subsurface temperatures? This technique may receive less attention than geological and geophysical tools but is just as valuable because it can determine the temperature of the fluids when they were last in equilibrium with rocks at depth. The method, called geothermometry, is based on two assumptions: (1) hydrothermal fluids equilibrate with common silicate minerals in rocks from the deepest part of the hydrothermal system; and (2) buoyant fluids ascend rapidly to the surface without interacting with shallower rocks at lower temperatures.
Chemical geothermometers based on silica, potassium, sodium, and calcium compositions were first developed in the 1970s by USGS scientists Robert Fournier and Alfred Truesdell. Data collected over the past 50 years shows that they can provide reasonable estimates of subsurface temperatures.
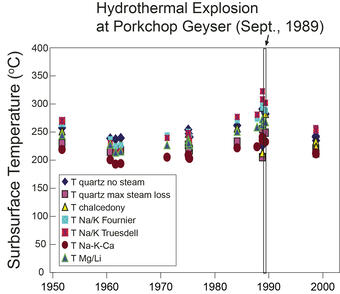
But can these geochemical geothermometers be applied to evaluate changes in hydrothermal systems and to forecast hydrothermal explosions? Tantalizing data from the 1989 Porkchop Geyser explosion in Norris Geyser Basin suggest that geothermometry may be a useful approach. Over the course of the years before it exploded, Porkchop Geyser transformed from a quiet hot spring into an infrequent small geyser, then into a perpetual spouter that erupted to heights of 6–9 meters (20–30 feet). On September 5, 1989, a sudden hydrothermal explosion sent boiling water, steam, mud, and rocks tens of meters (yards) into the air and resulted in a new crater more than 10 meters (33 feet) across. The hot spring at the Porkchop Geyser site had been sampled frequently from the 1920s up until the 1989 explosion and continues to present day.
After the Porkchop explosion, Robert Fournier used historical chemical data to calculate geothermometry temperatures and found dramatic increases of about 40–60 °C (72–108 °F) in the years leading up to the event. This result strongly suggests that temperature increase in hydrothermal fluid from depth can be an important driver and trigger of at least some hydrothermal explosions.
That said, the scatter of temperature data in the Porkchop calculations shows that conventional geothermometers have large uncertainties, in the range of +/- 25–50 °C (42–90 °F), which could obscure some temperature changes over time.
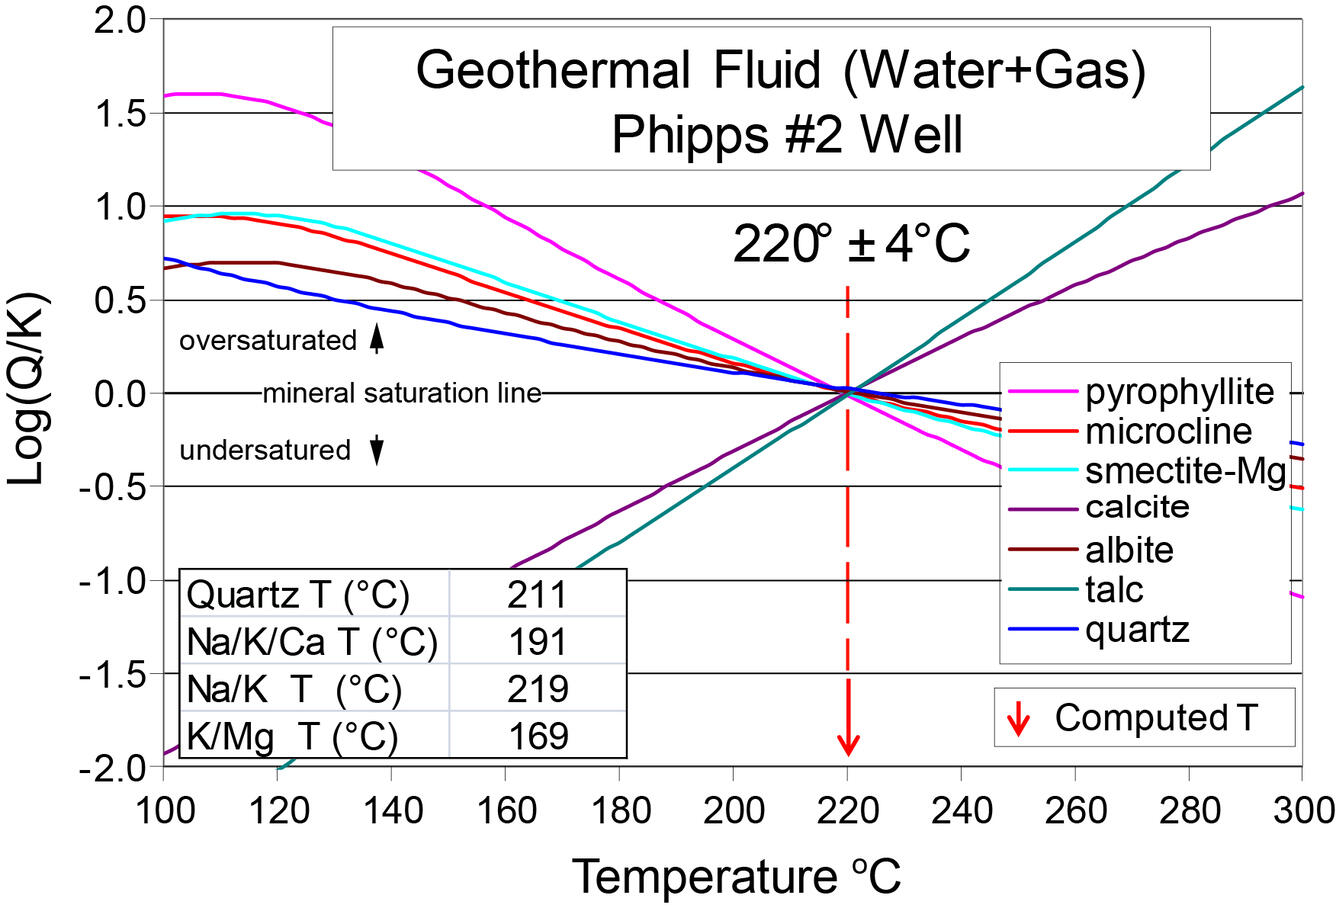
Over the last 10–15 years, newer approaches in geothermometry have been developed based on using thermodynamics to determine how different minerals behave at different temperatures. A test of these new methods for geothermal well fluids from Surprise Valley, CA, shows temperatures that converge on 220 ± 4 °C (428 ± 7 °F) for seven minerals known to be primary or alteration minerals in this system. These data are more precise and possibly more accurate than the originally applied chemical geothermometers, which average 198 ± 22 °C (388 ± 40 °F).
Applying these newer geothermometer techniques to hot spring water samples from Yellowstone may yield similarly precise datasets that could be used to track changes in hot spring activity over time—maybe even prior to hazardous explosive events. The toolkit of techniques that could be used to forecast hydrothermal changes, including explosions, at Yellowstone continues to grow!