Recent Monitoring Data
Rainfall | Groundwater Pressure | Slope Movement | Battery
Rainfall
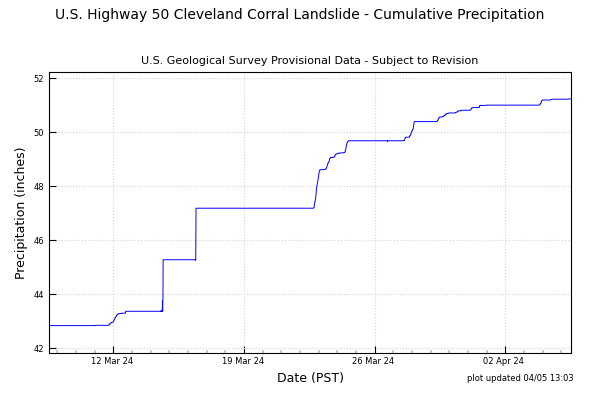
Graphs of raingage data show the cumulative precipitation, in inches, since the last gage reset. Typically, the raingage is reset to zero in October of each year, before the winter rains. The raingage is a "tipping spoon" model; each tip of the spoon records 0.01 inch of precipitation. The site does receive modest snow amounts during cold winter storms. Accumulated snow in the gage slowly melts and is recorded as precipitation.
4-Week Rain Gage Graph

Groundwater Pressure
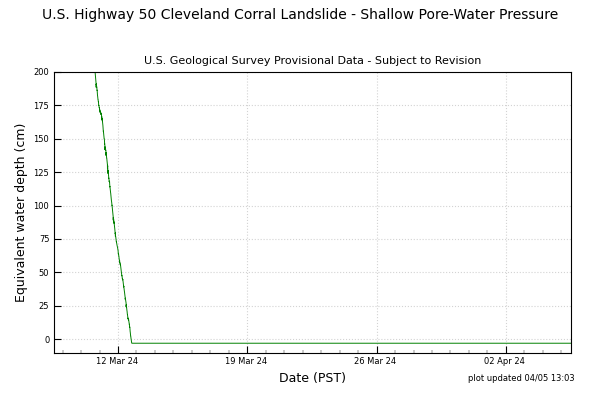
Graphs of pore-water pressure portray groundwater conditions at various depths, as noted on the graphs. Pressure at a particular depth is shown as an equivalent water depth, in centimeters. Groundwater in an open tube would rise to this height above the sensor. Sensors are bi-directional, temperature-compensated, amplified, strain-gauge type pressure transducers vented to the atmosphere and installed in a small diameter PVC casing. During dry periods (such as late summer or early fall), these sensors often record pore-water pressures near zero.
4-Week Shallow Pore-Water Pressure Graph (1.77 meters)

4-Week Deeper Pore-Water Pressure Graph

Slope Movement
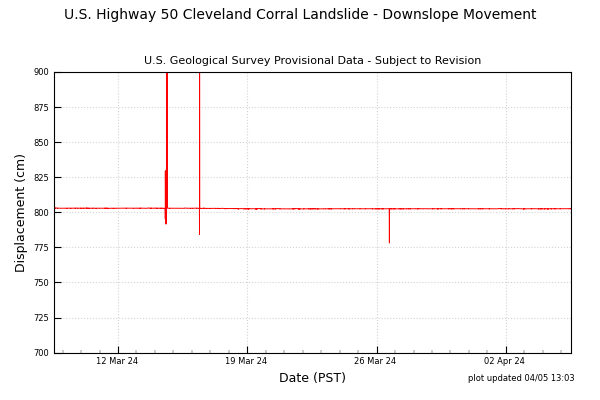
Graphs of slope movement show the cumulative downslope displacement, in centimeters, of the landslide relative to adjacent stable ground. Measured motion is downslope parallel to the ground surface; positive values indicate downslope movement. Sensor uses a linear position transducer with an extendable steel cable (extensometer). The instrument is anchored on stable ground and the end of the extendable cable is anchored on the slide. Sharp spikes in the graph are typically caused by snow loading; the cable extends when covered by snow and reverts to its original position when the snow melts or falls from the cable. Landslide movement is usually indicated by slow increasing displacement over many days.
4-Week Slope Movement Graph

Battery
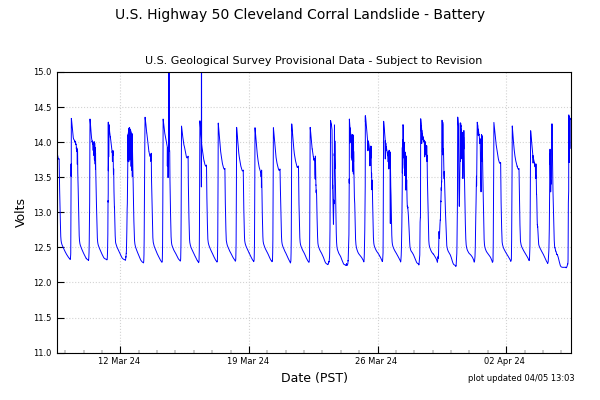
Graphs of battery data show power supply voltage at the data acquisition system. The system is nominally 12 volts and the battery is recharged by regulated input from a solar panel. Graphs typically show diurnal charging during the day and discharging during the night.
4-Week Battery Graph

Recent Monitoring Data
Rainfall | Groundwater Pressure | Slope Movement | Battery
Rainfall
Graphs of raingage data show the cumulative precipitation, in inches, since the last gage reset. Typically, the raingage is reset to zero in October of each year, before the winter rains. The raingage is a "tipping spoon" model; each tip of the spoon records 0.01 inch of precipitation. The site does receive modest snow amounts during cold winter storms. Accumulated snow in the gage slowly melts and is recorded as precipitation.
4-Week Rain Gage Graph

Groundwater Pressure
Graphs of pore-water pressure portray groundwater conditions at various depths, as noted on the graphs. Pressure at a particular depth is shown as an equivalent water depth, in centimeters. Groundwater in an open tube would rise to this height above the sensor. Sensors are bi-directional, temperature-compensated, amplified, strain-gauge type pressure transducers vented to the atmosphere and installed in a small diameter PVC casing. During dry periods (such as late summer or early fall), these sensors often record pore-water pressures near zero.
4-Week Shallow Pore-Water Pressure Graph (1.77 meters)

4-Week Deeper Pore-Water Pressure Graph

Slope Movement
Graphs of slope movement show the cumulative downslope displacement, in centimeters, of the landslide relative to adjacent stable ground. Measured motion is downslope parallel to the ground surface; positive values indicate downslope movement. Sensor uses a linear position transducer with an extendable steel cable (extensometer). The instrument is anchored on stable ground and the end of the extendable cable is anchored on the slide. Sharp spikes in the graph are typically caused by snow loading; the cable extends when covered by snow and reverts to its original position when the snow melts or falls from the cable. Landslide movement is usually indicated by slow increasing displacement over many days.
4-Week Slope Movement Graph

Battery
Graphs of battery data show power supply voltage at the data acquisition system. The system is nominally 12 volts and the battery is recharged by regulated input from a solar panel. Graphs typically show diurnal charging during the day and discharging during the night.
4-Week Battery Graph


