
This year marks the 150th anniversary — or sesquicentennial — of the historic expedition down the Green and Colorado rivers that Maj. John Wesley Powell and his nine-man crew undertook to survey one of the least explored regions of the West. How was mapping done then and how is it done today?
In the 19th Century
Maps have long been used as a navigation tool for delineating boundaries of landmasses and political boundaries, for forecasting weather, and for infrastructure planning, among other purposes. Geologic maps were used along with topographic maps to determine the best locations for roads and settlements, and to develop natural resources.
Topographic mapping of what was to become the United States started in the early days of exploration and colonization. By the time of Powell’s 1869 expedition, the Eastern and Midwestern states had been mapped but much less was known about the geology and terrain of the western part of the country.
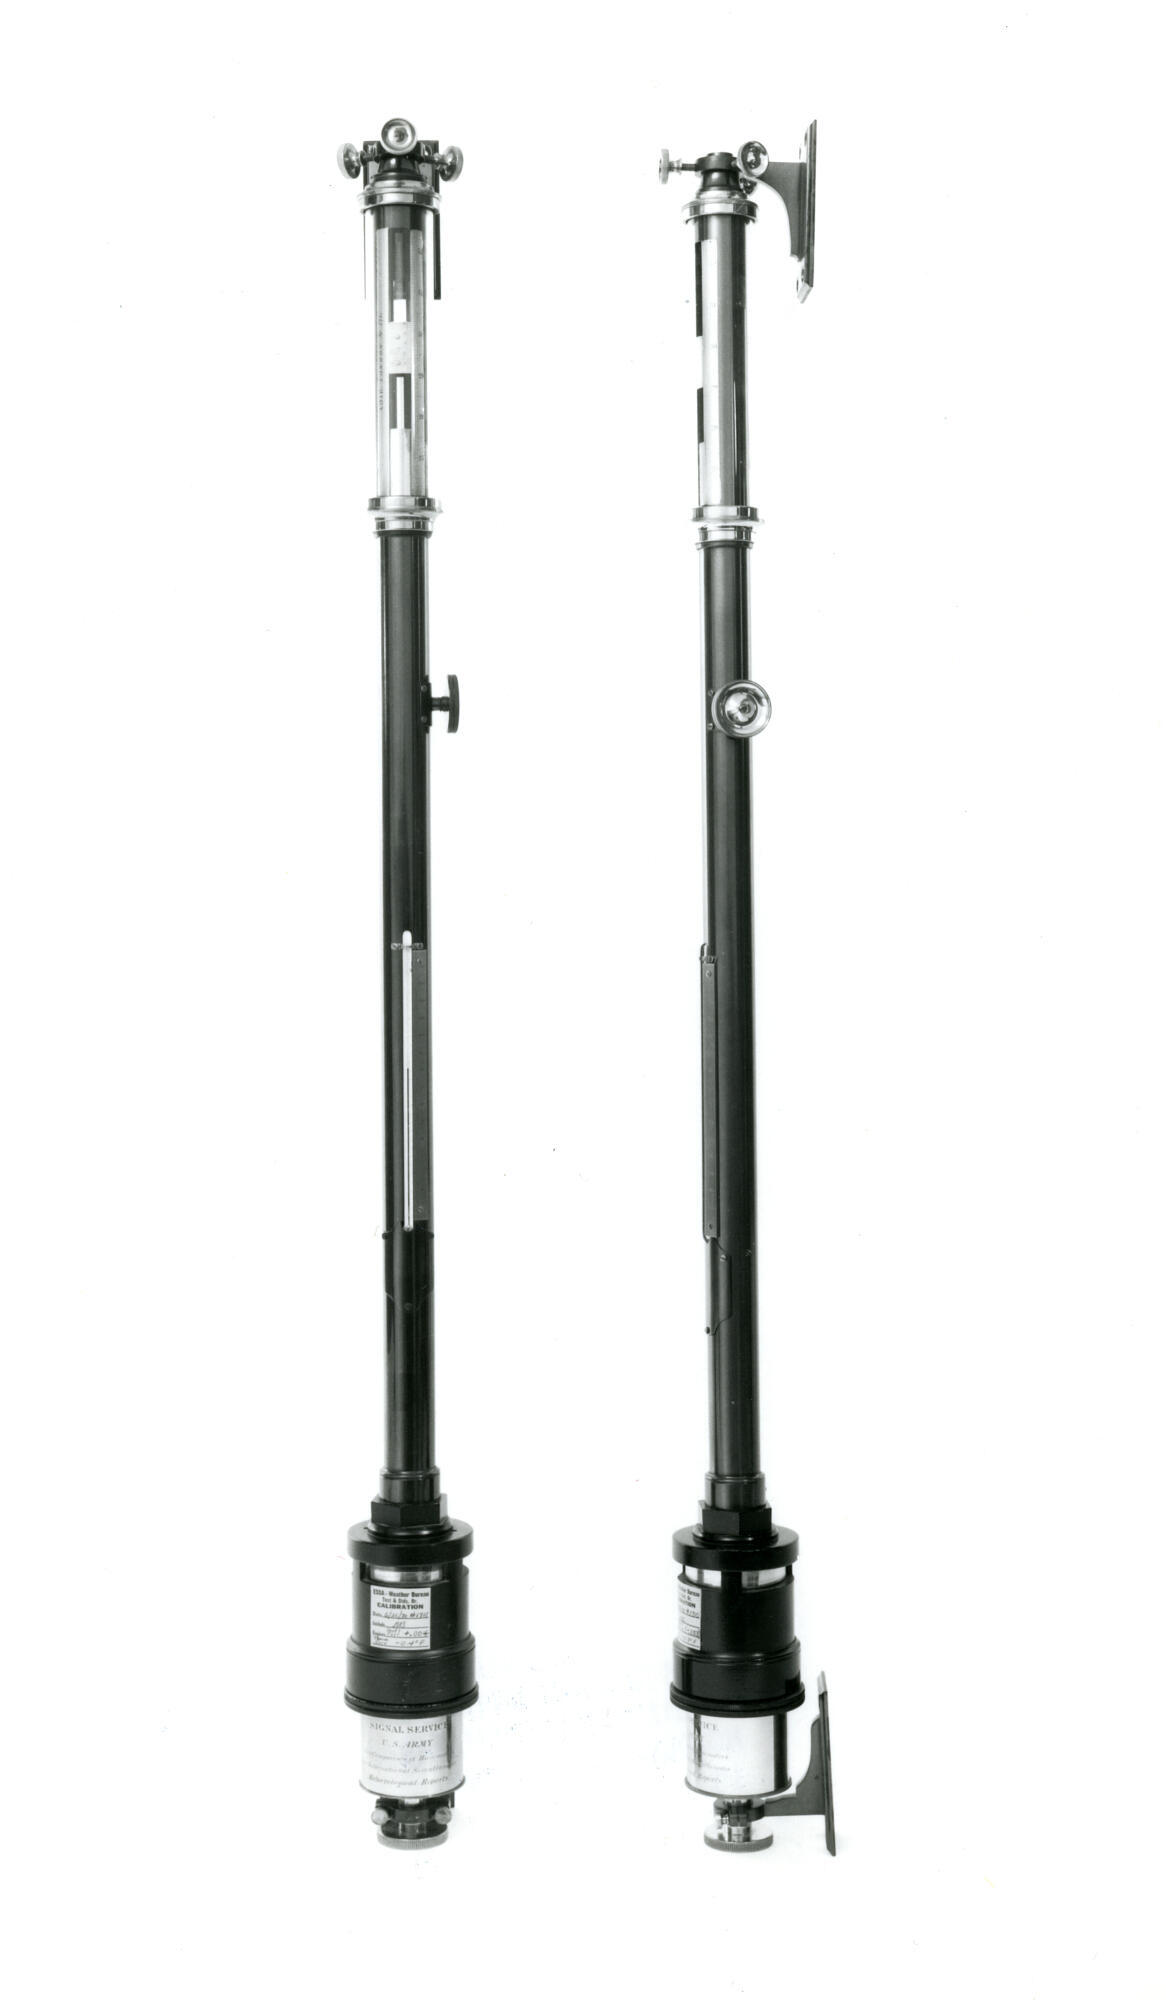
During the 1869 expedition, Powell and fellow geologist George Bradley took copious notes on the geology, collected rock and fossil samples, and made maps as the team went down the rivers and through the canyons. Accompanied by one or two other men, they would take side trips at various spots along the way to take measurements needed for topographic and geologic mapping. Their primary instruments were mercury barometers (see photo), sextants, thermometers, chronometers, and compasses. The barometers (used for measuring atmospheric pressure) were used with thermometers (temperature) and chronometers (time) to calculate elevation above sea level. Sextants allowed for geometrical calculations between two objects, and compasses were used to determine cardinal directions.
It was not until Powell’s second expedition in 1871–2, however, that enough accurate measurements were collected to produce reconnaissance geologic maps. By 1879, when Congress created the U.S. Geological Survey, more than half a dozen state geological surveys were already actively engaged in geologic mapping, and some had been active for more than 50 years. In 1882, the U.S. Geological Survey was authorized to “continue preparation of the geological map of the United States,” which Powell took as authorization to prepare a topographic map of the United States as well.
In the 21st Century
After an initial foray into unified geologic and topographic mapping, the cost of the effort became prohibitive and interest in a single map of the nation declined. As problems became more diverse and data needs became more specialized, mapmakers figured out that mapping was not “one size fits all” and that there were many uses for topographic maps apart from geology.
Mapping in the 20th century became focused on areas of economic interest, special concern, or critical scientific interest. For example, the North Slope of Alaska was mapped for its petroleum potential in the early 1920s and the Nevada Test Site for the feasibility of long-term storage of nuclear waste.
Current mapping is focused on stewardship of mineral and water resources and the environment, safe disposal of waste, and natural hazards. Geologic mapping focuses on practical aspects of geology such as active faults that pose earthquake hazards, areas particularly subject to landslides, volcanic hazards, and the movement of water, petroleum, natural gas, and waste (including radioactive) through geologic materials. Topographic mapping is done throughout the U.S. regardless of the scientific interest of the area and is increasingly automated.
The tools of geologic and topographic mapping have changed in the past century. Even though boots-on-the-ground geologists still use a compass, hammer, hand lens, and notebook, they are now aided by digital imagery and geophysical data from satellites, aircraft, and airborne unmanned vehicles. Topographic mapping has recently undergone a revolution with the advent of airborne mapping using laser-based light detection and ranging (LIDAR), which can measure changes in topography on the scale of centimeters or smaller to produce very high-resolution topographic maps. The USGS National Map is updated on a rotational basis every three years. Citizen scientists can contribute to the map by ground-truthing the location of structures, roads, and other features in their area. Contribute now.
Both geologic and topographic data can be processed through computer software to produce 3D models and illustrations. The geologic map of the future will be a fly-through, virtual-reality experience that will allow us to understand the architecture of the Earth as never before.

Related

John Wesley Powell Expedition—Then and Now.
Related