
Water Stargrass in the Lower Yakima River
Getting to the Root of the Issue
Untangling the relationships between water quality and aquatic ecosystems in the lower Yakima River
The lower Yakima River faces water resource management challenges resulting from abundant water plant growth, negatively impacting water quality. New U.S. Geological Survey (USGS) research provides a deeper understanding of river conditions, informing resource management to protect this river and the communities it supports.
The Benton Conservation District and Washington State Department of Ecology wanted to better understand the relationships between water quality and aquatic ecosystems in the lower Yakima River. Untangling these relationships will provide them with information necessary to develop effective management strategies and improve river conditions.
USGS brought expertise in water quality monitoring, analysis, and aquatic ecosystems research, producing science that is innovative and actionable. Read on to learn more about our efforts to understand water quality in this watershed, or jump to each section.
- The Issue
- Monitoring Water Quality
- Water Stargrass Growth
- Relating Water Quality and Stargrass
- Evaluating Stream Temperature
- Map
A River Grows Green
In Central Washington, the lower Yakima River flows 43 miles from the Prosser Dam to its confluence with the Columbia River. The river supplies water to agricultural fields, sustaining cultivation and forming the foundation of the economy in a region that receives little rainfall in the hot summer months.
Even as water from the Yakima irrigates orchards of apples and cherries, the river is brimming with life between its banks.
If you dangle your feet in the water on a warm summer day, you might feel the shivering brush of something against your ankle. Looking beneath the water, you’re likely to see green plumes, waving gently in the current.
This is water stargrass, a plant that grows in rivers. Though it is native to the lower Yakima River, water stargrass has grown problematically abundant since the early 2000s, causing a myriad of challenges for water management.
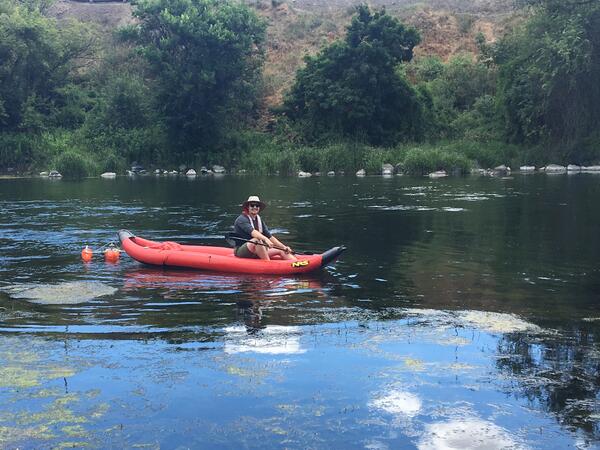
Thick mats of the plant clog river channels, slowing the flow of water and increasing the water temperature. Motorboat propellers and kayak paddles become tangled in the stringy stalks. Irrigation gates and dam mechanics become snarled in the growth.
The profusion of water stargrass impacts other plants and animals living in the river - ripples which are felt up the food web. Spawning fish lay their eggs in river gravels, which may be rendered inaccessible by plant growth. Stargrass has also been linked to poor water quality.
Testing the Waters
The USGS operates a network of thousands of streamgages that measure flows in rivers across the nation, including the Yakima River.
We installed water quality monitoring equipment at two of these existing streamgages, and we established a third monitoring location. During the warmer months, we measured several parameters, including water temperature, pH, dissolved oxygen, specific conductance, and turbidity. Scientists also collected and analyzed water samples for additional parameters of interest.
The continuous water quality records are available through the USGS’s Water Data for the Nation web service. You can view trends over time and make comparisons between different parameters and different monitoring locations.
Get continuous water quality data
Yakima River at Prosser, WA
Yakima River at Kiona, WA
Yakima River at Van Giesen BR Near Richland, WA
Down in the weeds
Water stargrass growth motivated this study, so USGS scientists needed to determine just how much of the plant grows in the river. We collected data several times during summer to determine how plant growth impacted local water quality.
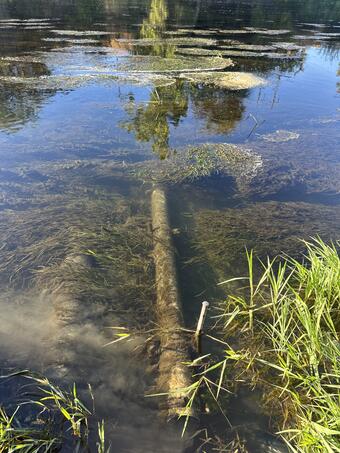
USGS scientists surveyed water stargrass along transects, stopping at regularly spaced points to see whether the plant was present or absent. This gave an estimate of how much of the river bottom is covered by the plant.
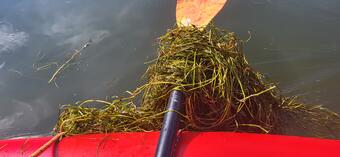
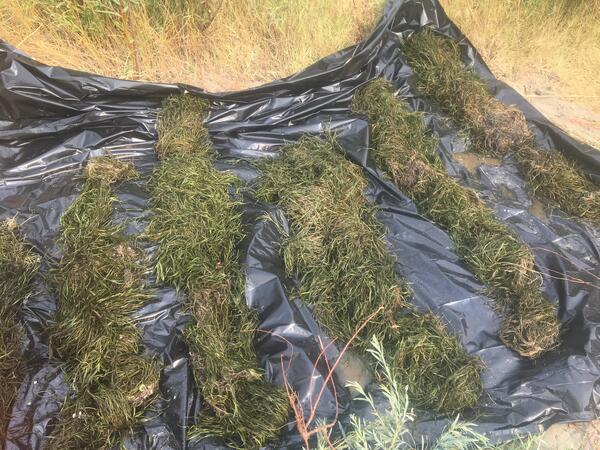
We also harvested all the plant growth from random quadrants on the river bottom. We dried the plants and weighed them to estimate the total biomass.
Combined, this information provided an estimate of the overall metabolism of the reach and estimates of growth of plants in a stream.
Revealing connections: water quality and water stargrass
After gathering a robust dataset, we set out to study the impacts of water stargrass on daily cycles of water quality and temperature on the lower Yakima River.
We found that the lower Yakima River isn’t doing so hot, or rather, it is often too hot. Water quality monitoring revealed frequent exceedances of water quality criteria for temperature, dissolved oxygen, and pH in the summer months. These exceedances are a known problem for the lower Yakima River and are part of the motivation for this research.
The USGS study provides new information about the relationship between detrimental water quality conditions and water stargrass growth. We found evidence of relationships between water quality metrics and water stargrass abundance, but the relationships were not consistent across all three locations.
We also found that high flows in the spring likely impact the abundance of water stargrass growing in the river.
USGS research continues to untangle these complex relationships, providing actionable information to water resource managers as they adapt management strategies.
Keeping it cool
Water stargrass is not the only thing stressing fish in the lower Yakima. Salmon are particularly sensitive to warm water. Managers need to know where areas with cooler water, known as cold-water anomalies, are located to protect critical habitat for migrating fish and plan river restoration activities.
Bringing expertise from water temperature surveys conducted across the state, the USGS investigated the local nuances of the lower Yakima River.
In 2018, scientists floated the length of the lower Yakima River, dragging water temperature sensors near the riverbed. They constructed longitudinal profiles of temperature, essentially drawing a heat map of the river. They identified several areas with cooler water, then examined what factors might be responsible for creating these zones.
The scientists followed up by placing temperature sensors in the cooler zones to track how temperatures changed through time and shifted through space.
Water temperature profiles
Thermal heterogeneity
Temperature data
Cold-water areas
Title
Title
The lower Yakima River faces water resource management challenges resulting from abundant water plant growth, negatively impacting water quality. New U.S. Geological Survey (USGS) research provides a deeper understanding of river conditions, informing resource management to protect this river and the communities it supports.
The Benton Conservation District and Washington State Department of Ecology wanted to better understand the relationships between water quality and aquatic ecosystems in the lower Yakima River. Untangling these relationships will provide them with information necessary to develop effective management strategies and improve river conditions.
USGS brought expertise in water quality monitoring, analysis, and aquatic ecosystems research, producing science that is innovative and actionable. Read on to learn more about our efforts to understand water quality in this watershed, or jump to each section.
- The Issue
- Monitoring Water Quality
- Water Stargrass Growth
- Relating Water Quality and Stargrass
- Evaluating Stream Temperature
- Map
A River Grows Green
In Central Washington, the lower Yakima River flows 43 miles from the Prosser Dam to its confluence with the Columbia River. The river supplies water to agricultural fields, sustaining cultivation and forming the foundation of the economy in a region that receives little rainfall in the hot summer months.
Even as water from the Yakima irrigates orchards of apples and cherries, the river is brimming with life between its banks.
If you dangle your feet in the water on a warm summer day, you might feel the shivering brush of something against your ankle. Looking beneath the water, you’re likely to see green plumes, waving gently in the current.
This is water stargrass, a plant that grows in rivers. Though it is native to the lower Yakima River, water stargrass has grown problematically abundant since the early 2000s, causing a myriad of challenges for water management.
Thick mats of the plant clog river channels, slowing the flow of water and increasing the water temperature. Motorboat propellers and kayak paddles become tangled in the stringy stalks. Irrigation gates and dam mechanics become snarled in the growth.
The profusion of water stargrass impacts other plants and animals living in the river - ripples which are felt up the food web. Spawning fish lay their eggs in river gravels, which may be rendered inaccessible by plant growth. Stargrass has also been linked to poor water quality.
Testing the Waters
The USGS operates a network of thousands of streamgages that measure flows in rivers across the nation, including the Yakima River.
We installed water quality monitoring equipment at two of these existing streamgages, and we established a third monitoring location. During the warmer months, we measured several parameters, including water temperature, pH, dissolved oxygen, specific conductance, and turbidity. Scientists also collected and analyzed water samples for additional parameters of interest.
The continuous water quality records are available through the USGS’s Water Data for the Nation web service. You can view trends over time and make comparisons between different parameters and different monitoring locations.
Get continuous water quality data
Yakima River at Prosser, WA
Yakima River at Kiona, WA
Yakima River at Van Giesen BR Near Richland, WA
Down in the weeds
Water stargrass growth motivated this study, so USGS scientists needed to determine just how much of the plant grows in the river. We collected data several times during summer to determine how plant growth impacted local water quality.
USGS scientists surveyed water stargrass along transects, stopping at regularly spaced points to see whether the plant was present or absent. This gave an estimate of how much of the river bottom is covered by the plant.
We also harvested all the plant growth from random quadrants on the river bottom. We dried the plants and weighed them to estimate the total biomass.
Combined, this information provided an estimate of the overall metabolism of the reach and estimates of growth of plants in a stream.
Revealing connections: water quality and water stargrass
After gathering a robust dataset, we set out to study the impacts of water stargrass on daily cycles of water quality and temperature on the lower Yakima River.
We found that the lower Yakima River isn’t doing so hot, or rather, it is often too hot. Water quality monitoring revealed frequent exceedances of water quality criteria for temperature, dissolved oxygen, and pH in the summer months. These exceedances are a known problem for the lower Yakima River and are part of the motivation for this research.
The USGS study provides new information about the relationship between detrimental water quality conditions and water stargrass growth. We found evidence of relationships between water quality metrics and water stargrass abundance, but the relationships were not consistent across all three locations.
We also found that high flows in the spring likely impact the abundance of water stargrass growing in the river.
USGS research continues to untangle these complex relationships, providing actionable information to water resource managers as they adapt management strategies.
Keeping it cool
Water stargrass is not the only thing stressing fish in the lower Yakima. Salmon are particularly sensitive to warm water. Managers need to know where areas with cooler water, known as cold-water anomalies, are located to protect critical habitat for migrating fish and plan river restoration activities.
Bringing expertise from water temperature surveys conducted across the state, the USGS investigated the local nuances of the lower Yakima River.
In 2018, scientists floated the length of the lower Yakima River, dragging water temperature sensors near the riverbed. They constructed longitudinal profiles of temperature, essentially drawing a heat map of the river. They identified several areas with cooler water, then examined what factors might be responsible for creating these zones.
The scientists followed up by placing temperature sensors in the cooler zones to track how temperatures changed through time and shifted through space.