
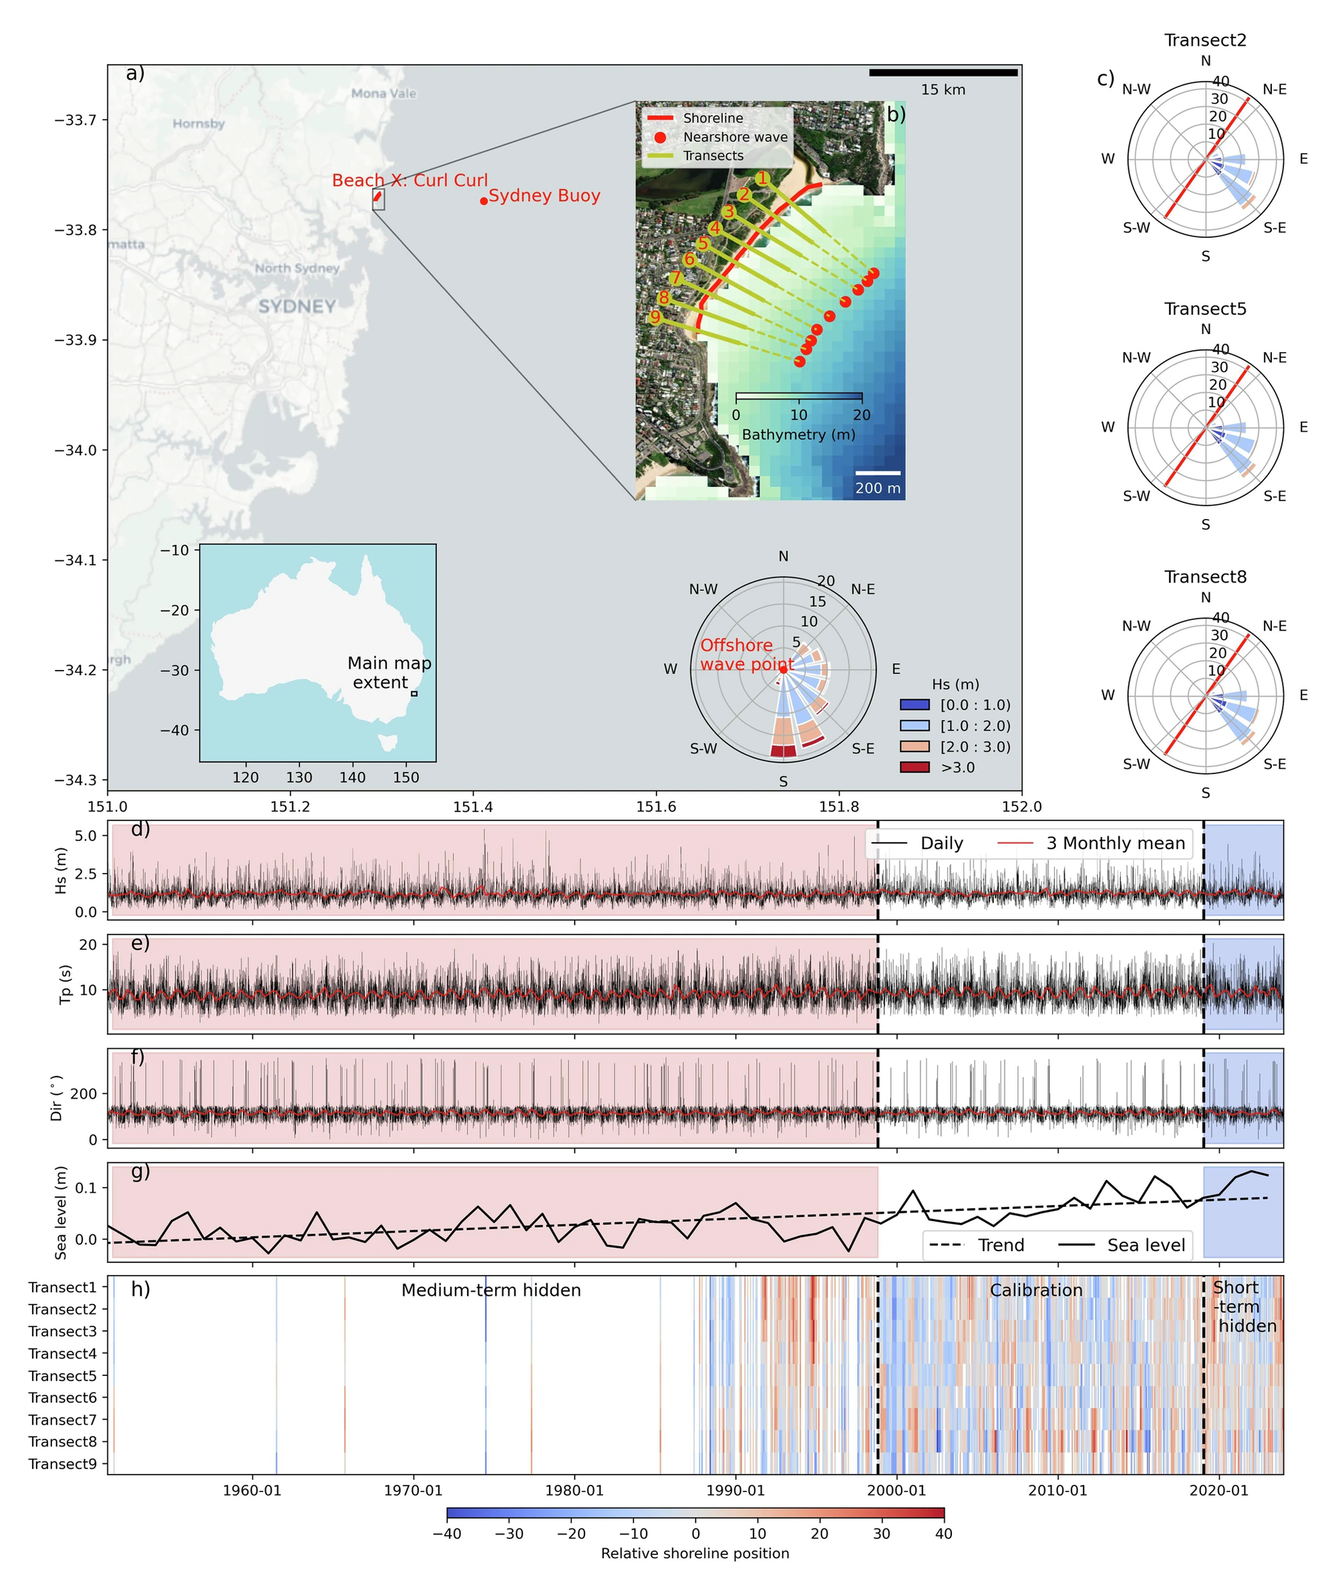
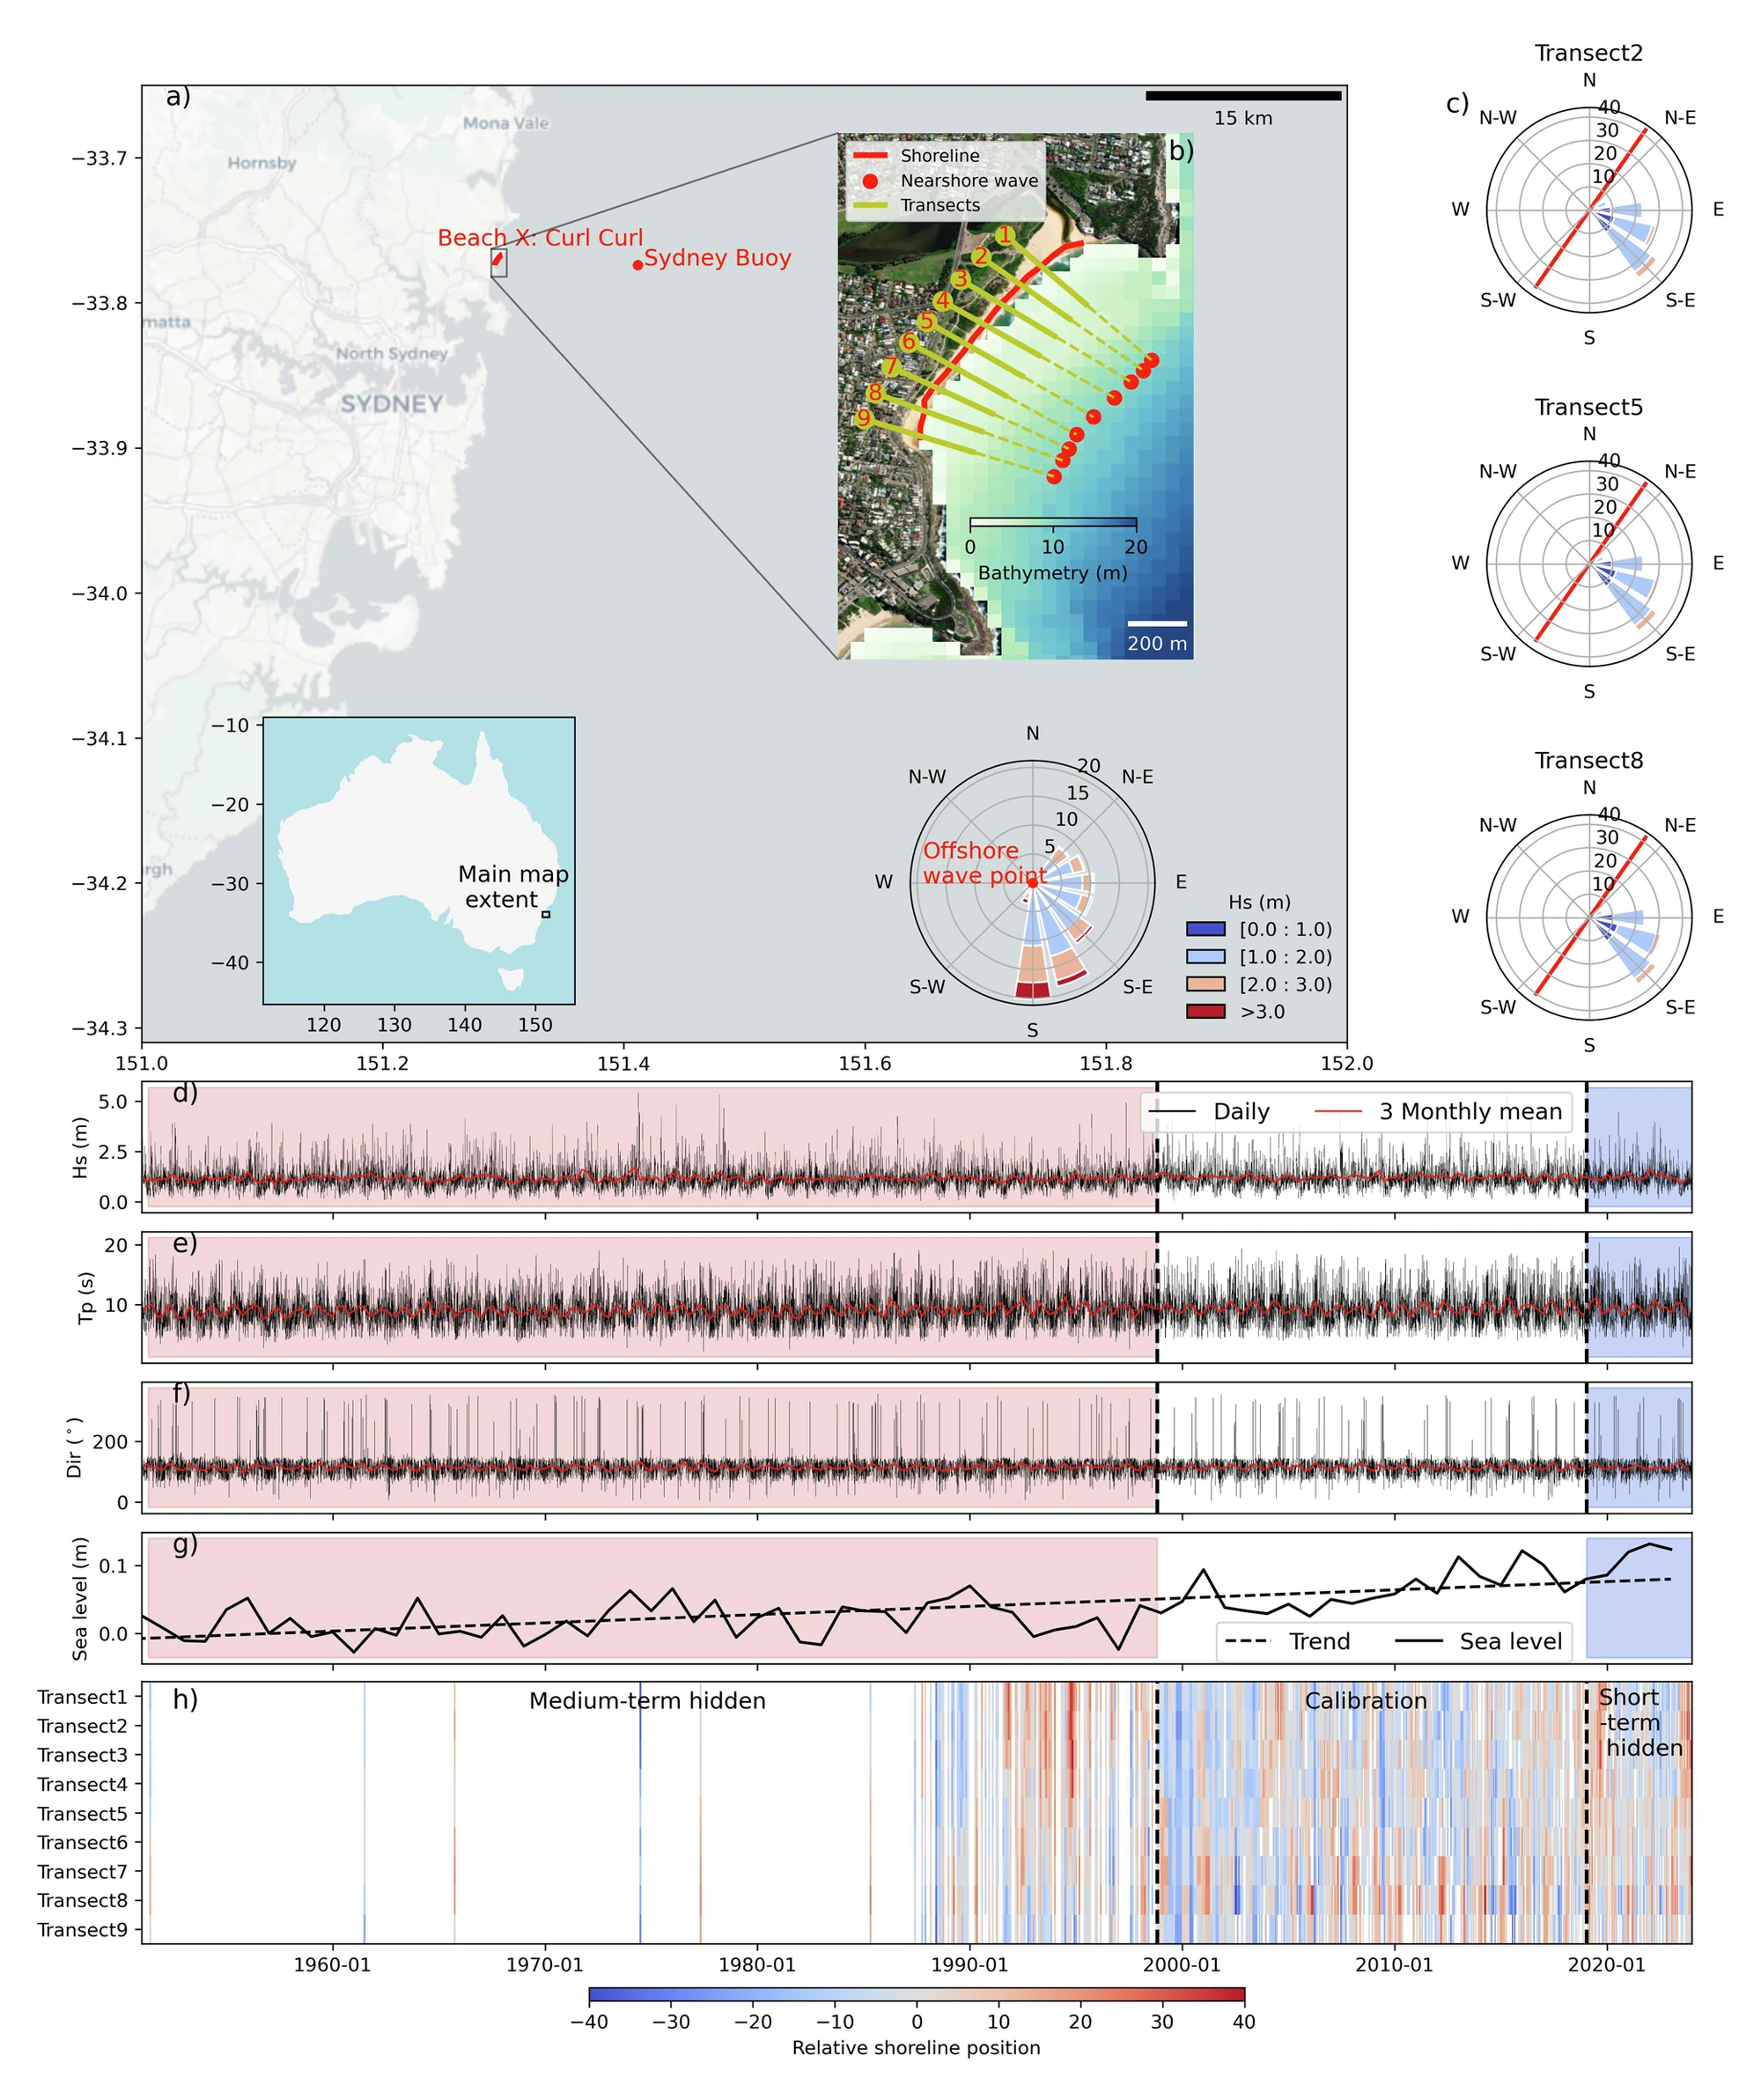
Detailed map of BeachX, Curl Curl Beach, New South Wales, Australia
Detailed Description
Location of BeachX. Inset wave rose shows the location and distribution of offshore waves from ERA5. b The detailed map of BeachX (Curl Curl Beach, New South Wales, Australia). The color gradient at the seaside indicates bathymetry. Yellow lines represent transects. Red dots show the location of nearshore waves. c Nearshore (depth = 10 m) wave roses for transects 2, 5 and 8. The red solid line represents the mean beach orientation. d Significant wave height (e) peak wave period (f) mean wave direction (g) annual mean sea level and its trend. h Spatio-temporal distribution of relative (de-meaned) shoreline position (blue/negative values indicating erosion and red/positive values indicating accretion). From the study Benchmarking shoreline prediction models over multi-decadal timescales.
Sources/Usage
Public Domain.