
How does social vulnerability relate to water limitation?
By Water Science School
June 2025 (approx.)
Detailed Description
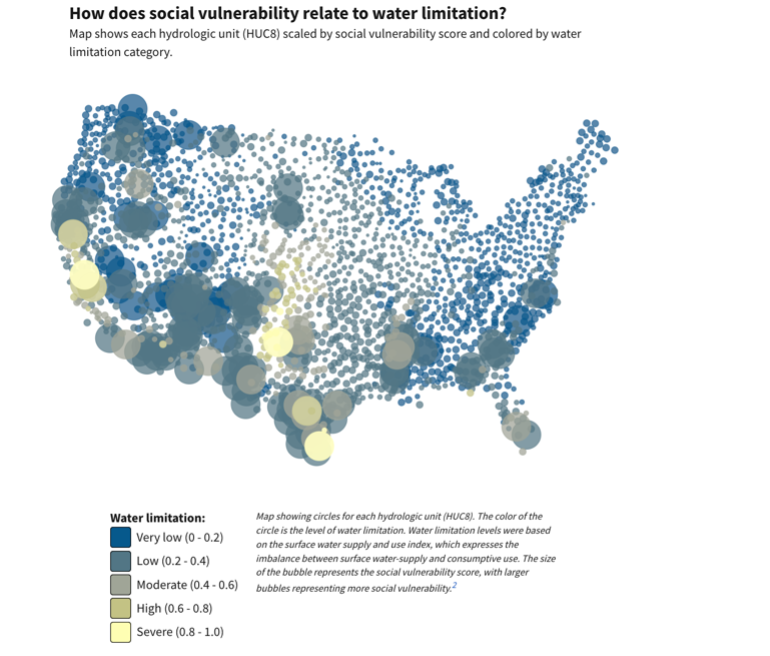
Map showing circles for each hydrologic unit (HUC8). The color of the circle is the level of water limitation. Water limitation levels were based on the surface water supply and use index, which expresses the imbalance between surface water-supply and consumptive use. The size of the bubble represents the social vulnerability score, with larger bubbles representing more social vulnerability.
Image from: https://water.usgs.gov/vizlab/water-availability/
Sources/Usage
Public Domain.