
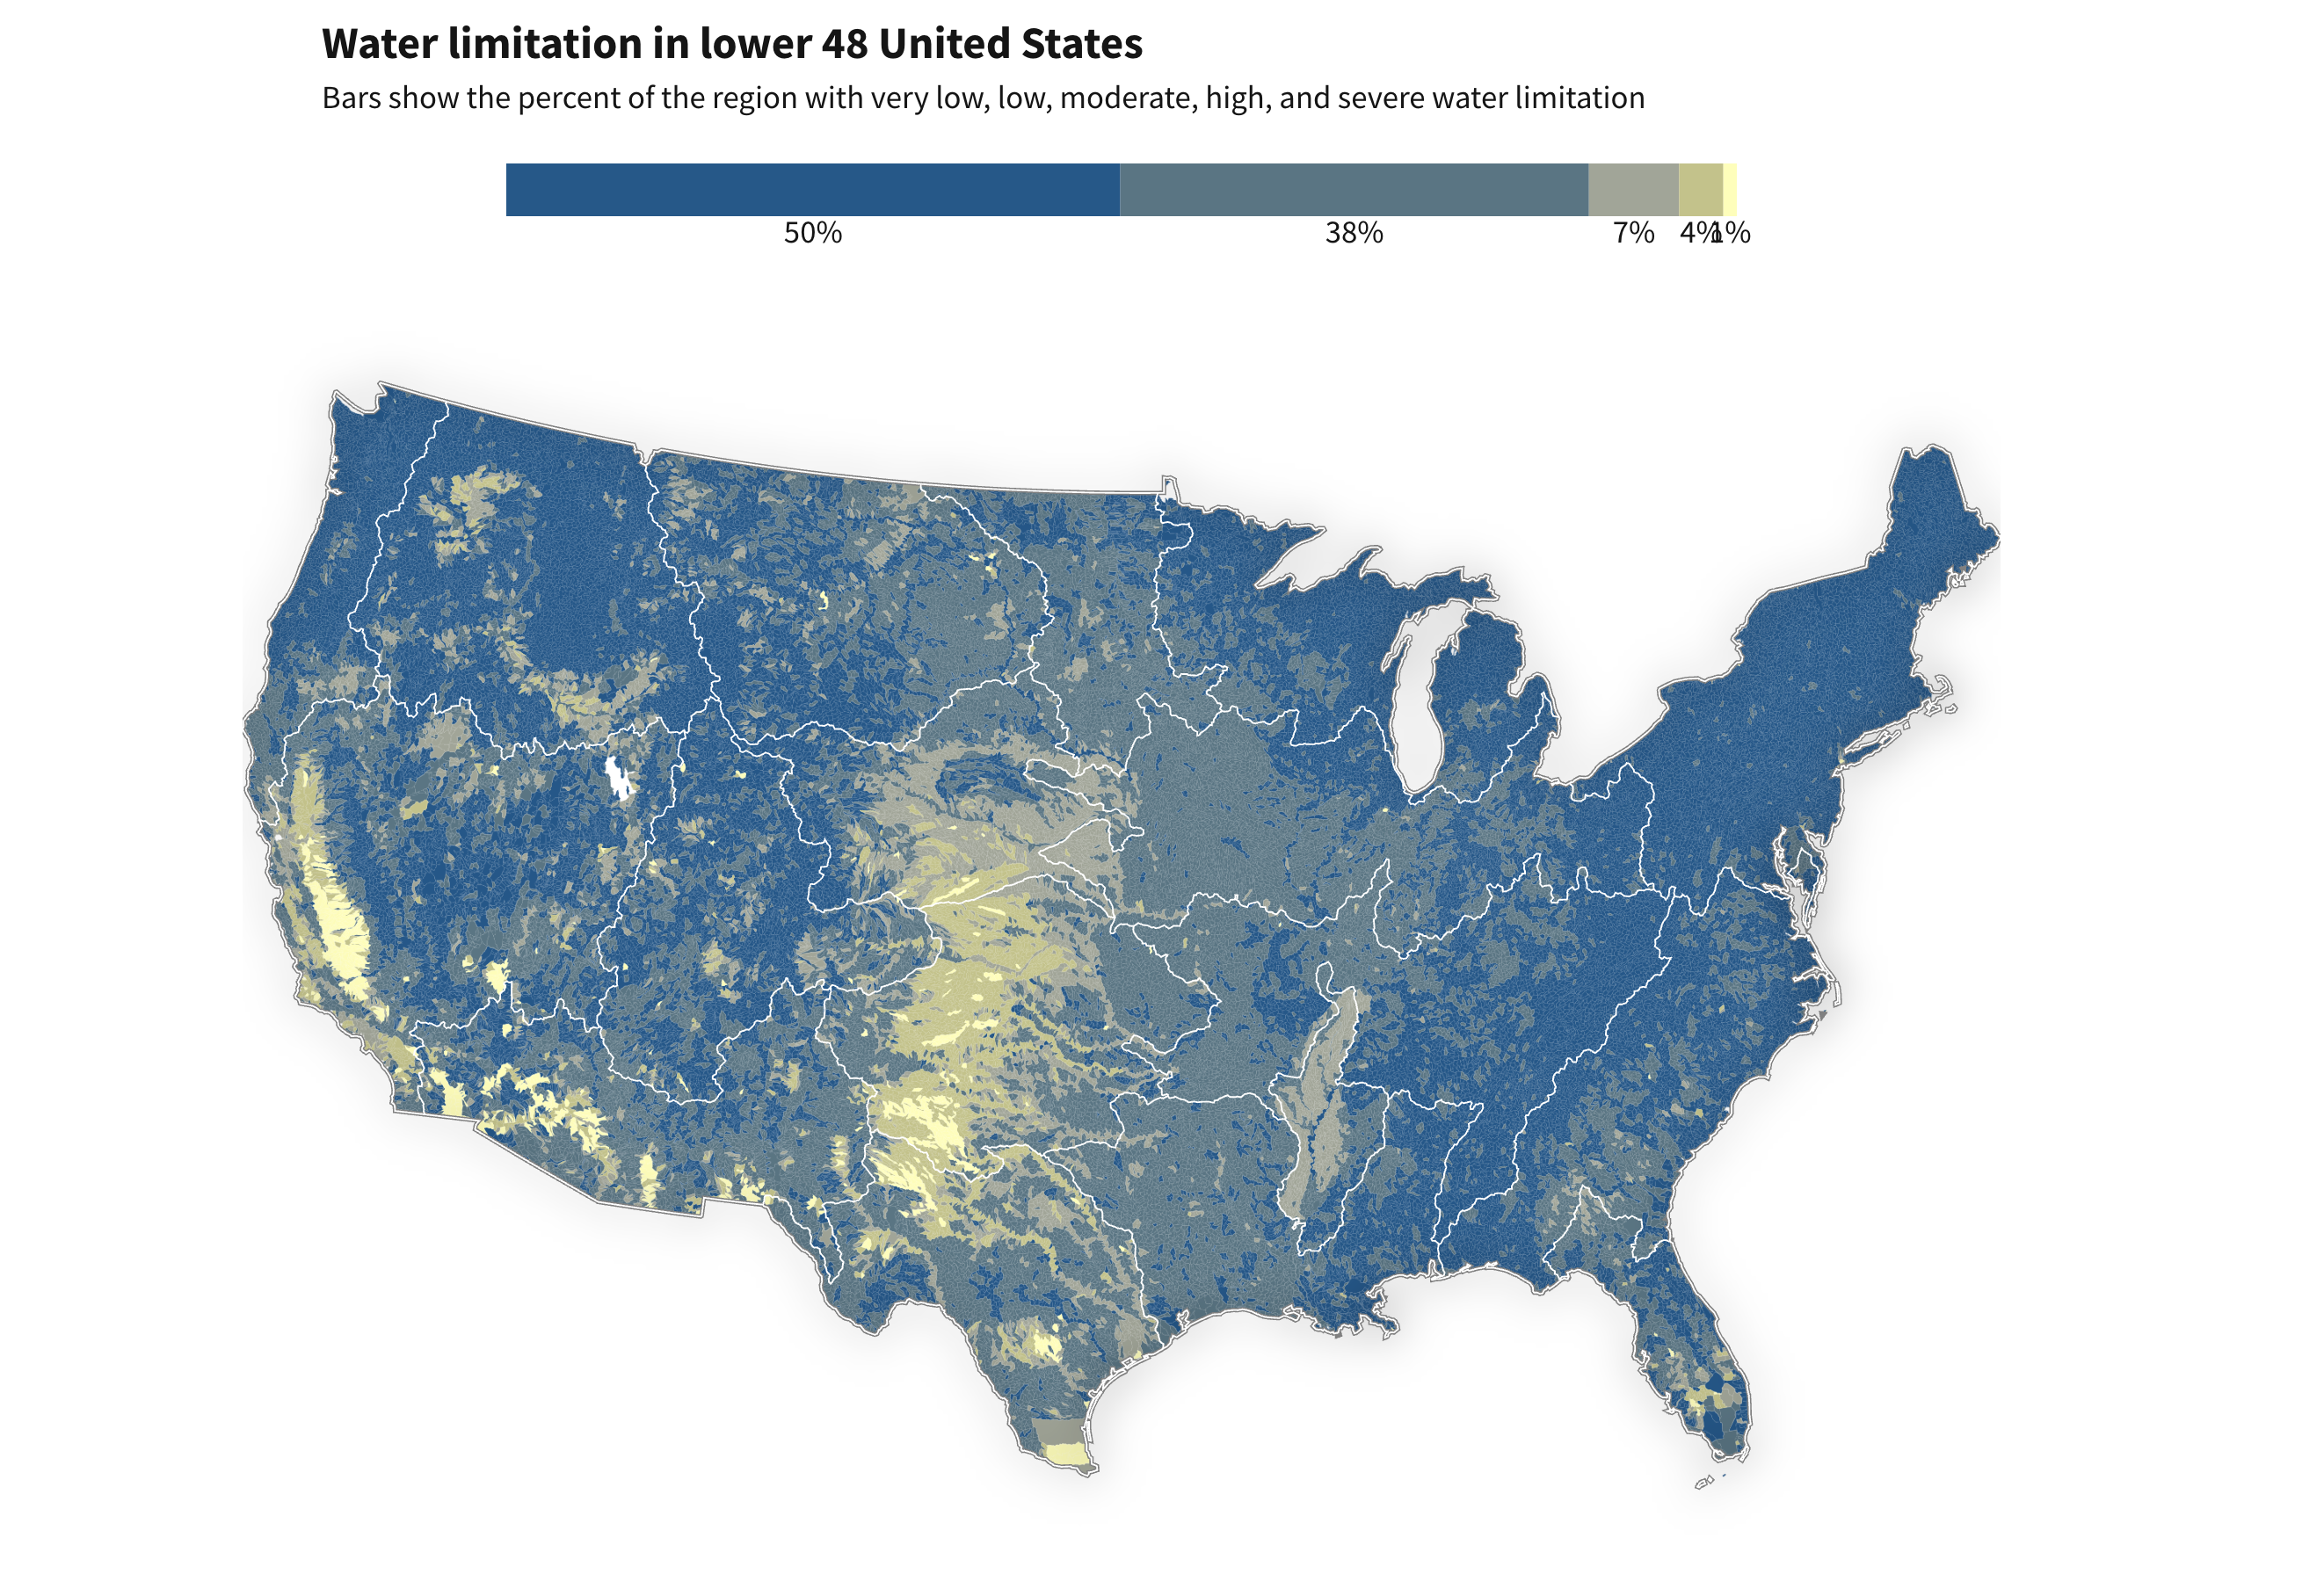
Water limitation in lower 48 United States
By Water Science School
June 2025 (approx.)

Detailed Description
Water limitation across the lower 48 United States, shown as the average from 2010 to 2020 for each watershed (HUC12). The bar chart shows the proportion of each water limitation category. Water limitation levels were based on the surface water supply and use index, which expresses the imbalance between surface water-supply and consumptive use.
Image from: https://water.usgs.gov/vizlab/water-availability/
Sources/Usage
Public Domain.