
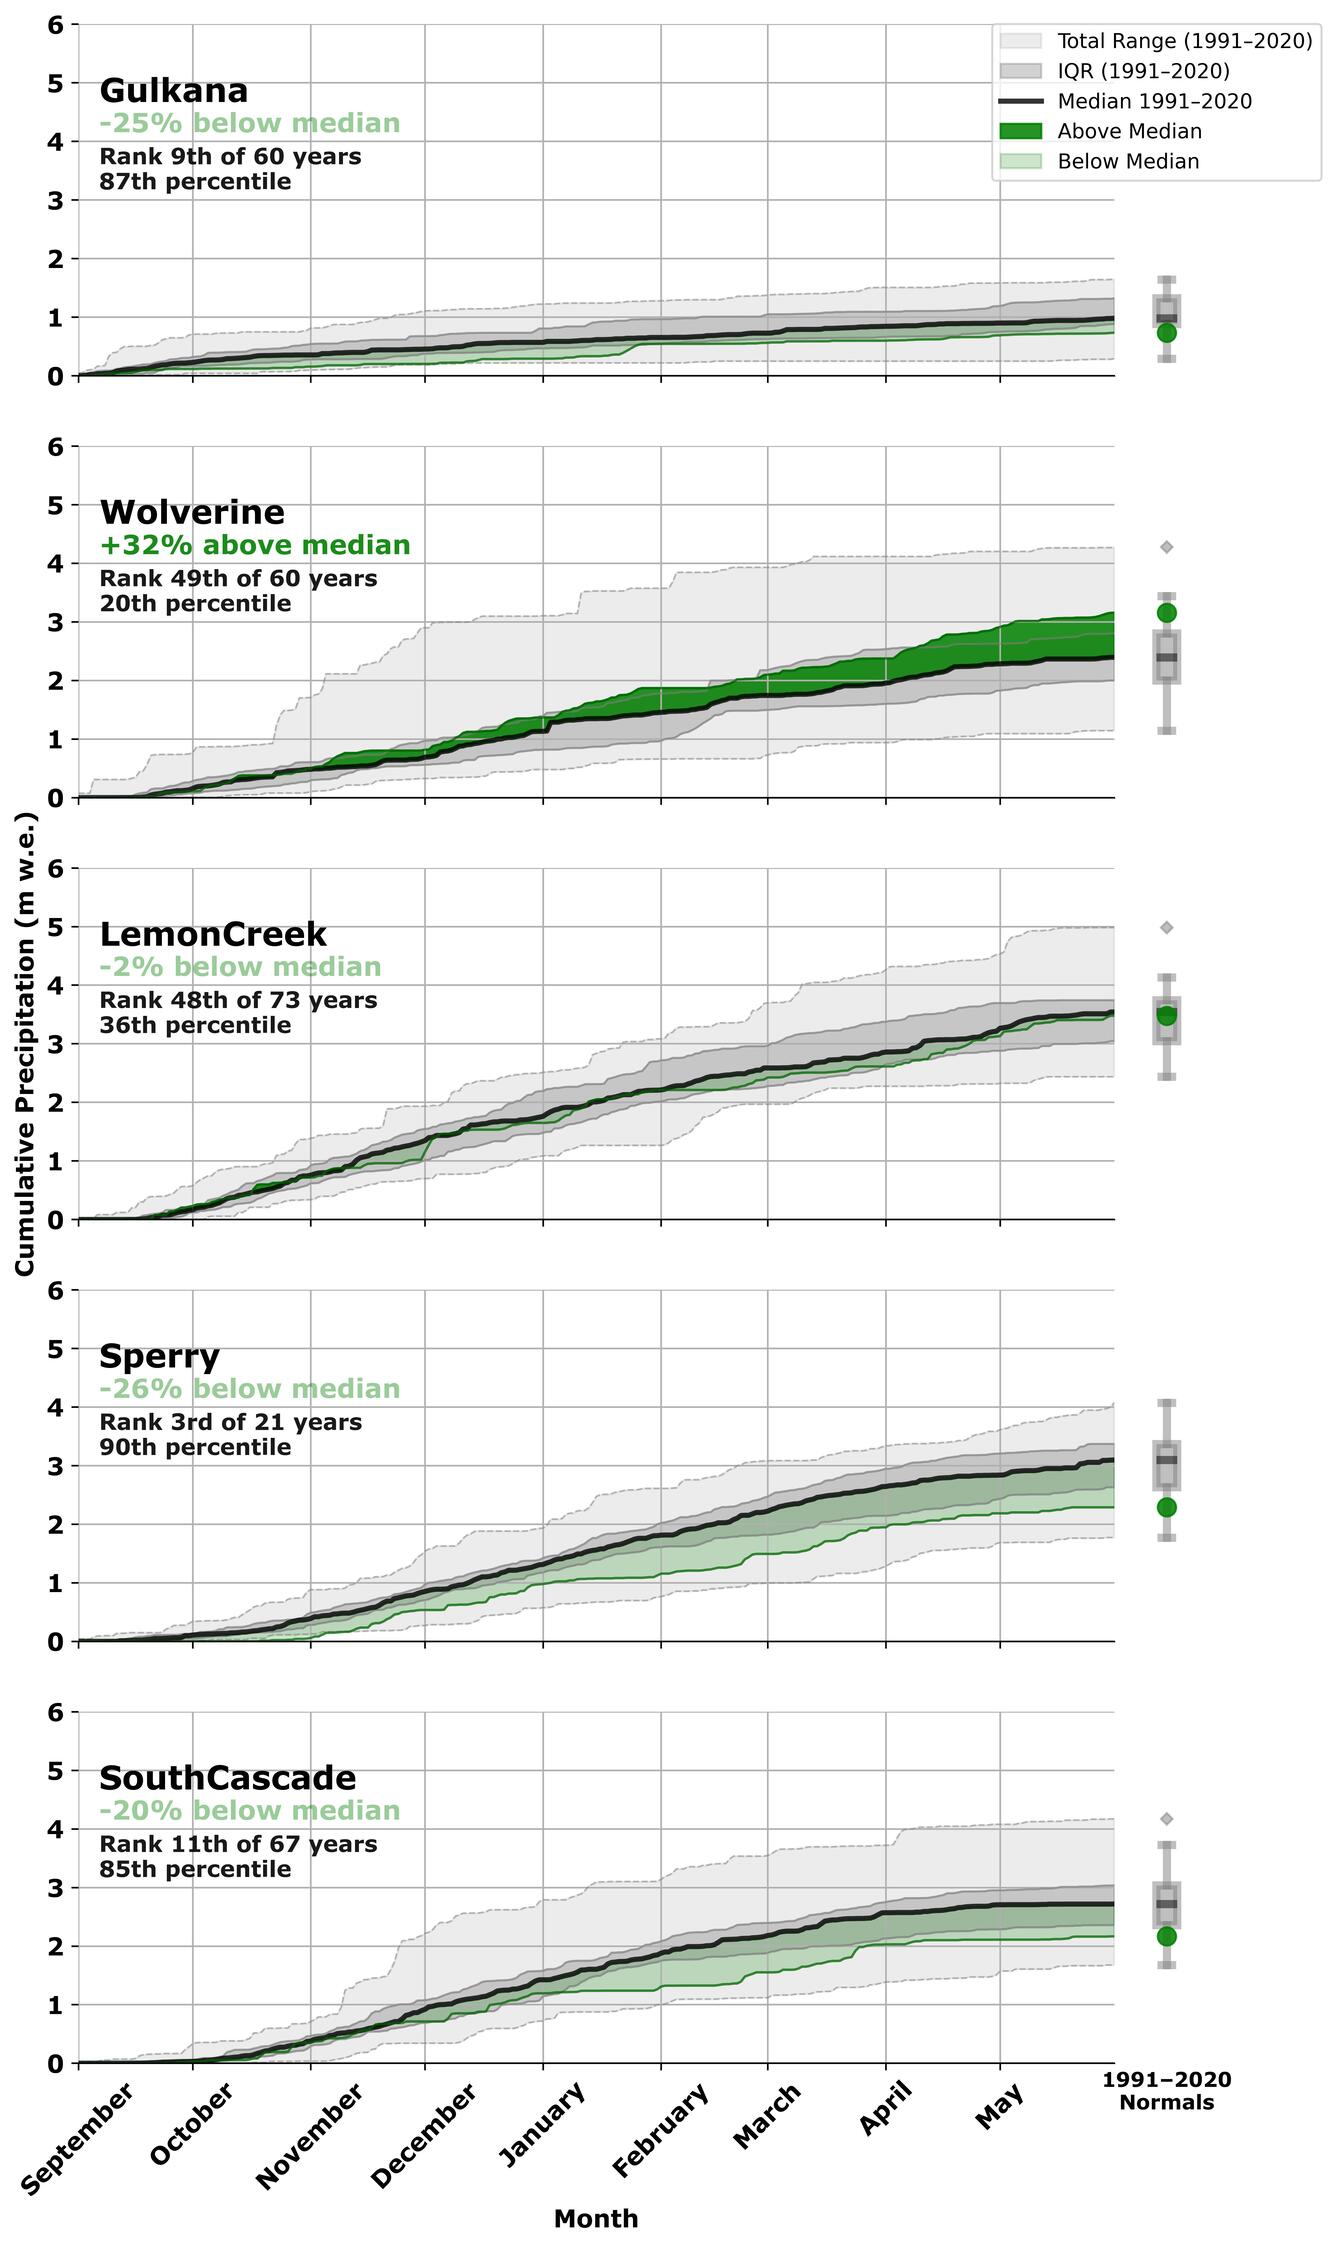
2024-25 USGS Benchmark Glaciers Accumulation Season Precipitation
Detailed Description
Cumulative 2024 – 25 accumulation season precipitation (m w.e.), Sept. 1–May 30th, at the median elevation of each USGS Benchmark glacier, based on local weather station data (O'Neel et al., 2019; https://doi.org/10.5066/F7HD7SRF). The bold black line shows the 1991–2020 median, with dark gray shading indicating the interquartile range and light gray shading the total historical range for the reference period. Dark green shading indicates periods where 2025 accumulation exceeded the 1991–2020 median; light green shading indicates periods where it fell below. Boxplots at right summarize the full period-of-record distribution of seasonal precipitation totals for each glacier, with the box spanning the interquartile range, the internal line marking the median, whiskers extending to the total range, and the colored dot indicating the 2025 seasonal value. Rank and percentile are reported relative to each glacier's individual period of record. Total winter precipitation ranks are reported from lowest (driest) to highest (wettest).
Sources/Usage
Public Domain.
Related
2025 USGS Benchmark Glaciers Executive Summary
Glaciers and Landscape Change
Related
2025 USGS Benchmark Glaciers Executive Summary