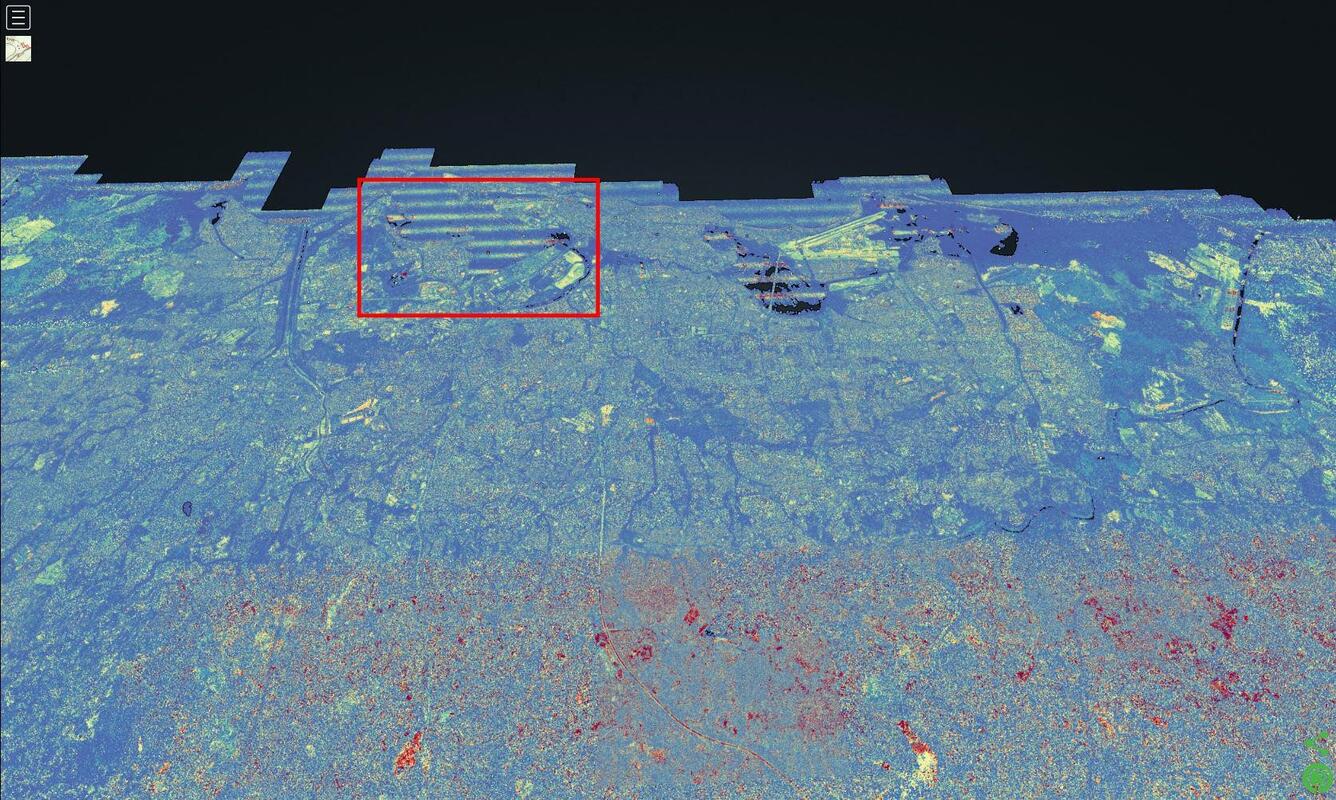
3DEP, Lidar point cloud, Pre-Hurricane Maria
Detailed Description
Figure 2: Zooming in to red rectangle A from figure 1. Points colored by laser intensity (blue = low intensity, red = high intensity).
Sources/Usage
Public Domain.

Official websites use .gov
A .gov website belongs to an official government organization in the United States.
Secure .gov websites use HTTPS
A lock () or https:// means you’ve safely connected to the .gov website. Share sensitive information only on official, secure websites.
Figure 2: Zooming in to red rectangle A from figure 1. Points colored by laser intensity (blue = low intensity, red = high intensity).
Public Domain.