



A Sample Page of the Site Characterization Report Displaying the New BLM Terrestrial Monitoring Data Charts


Detailed Description
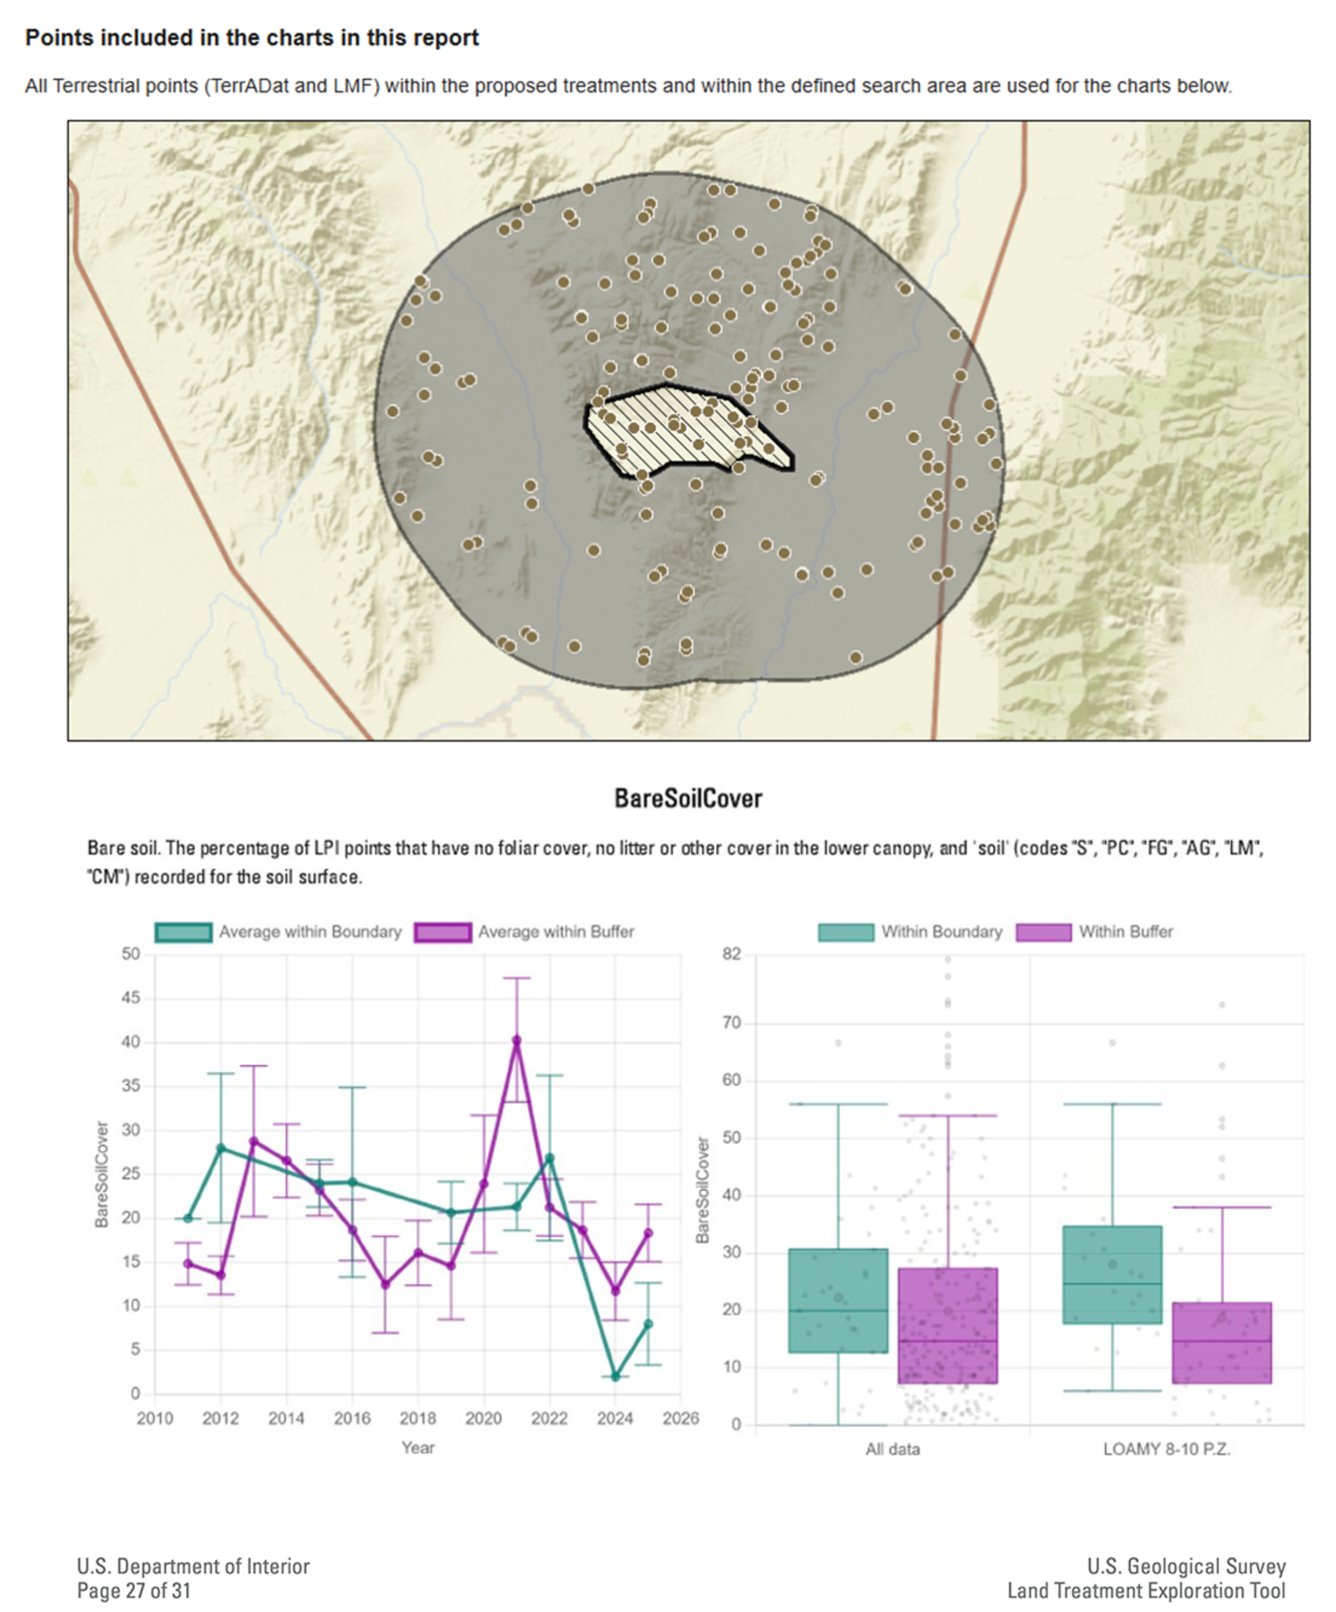
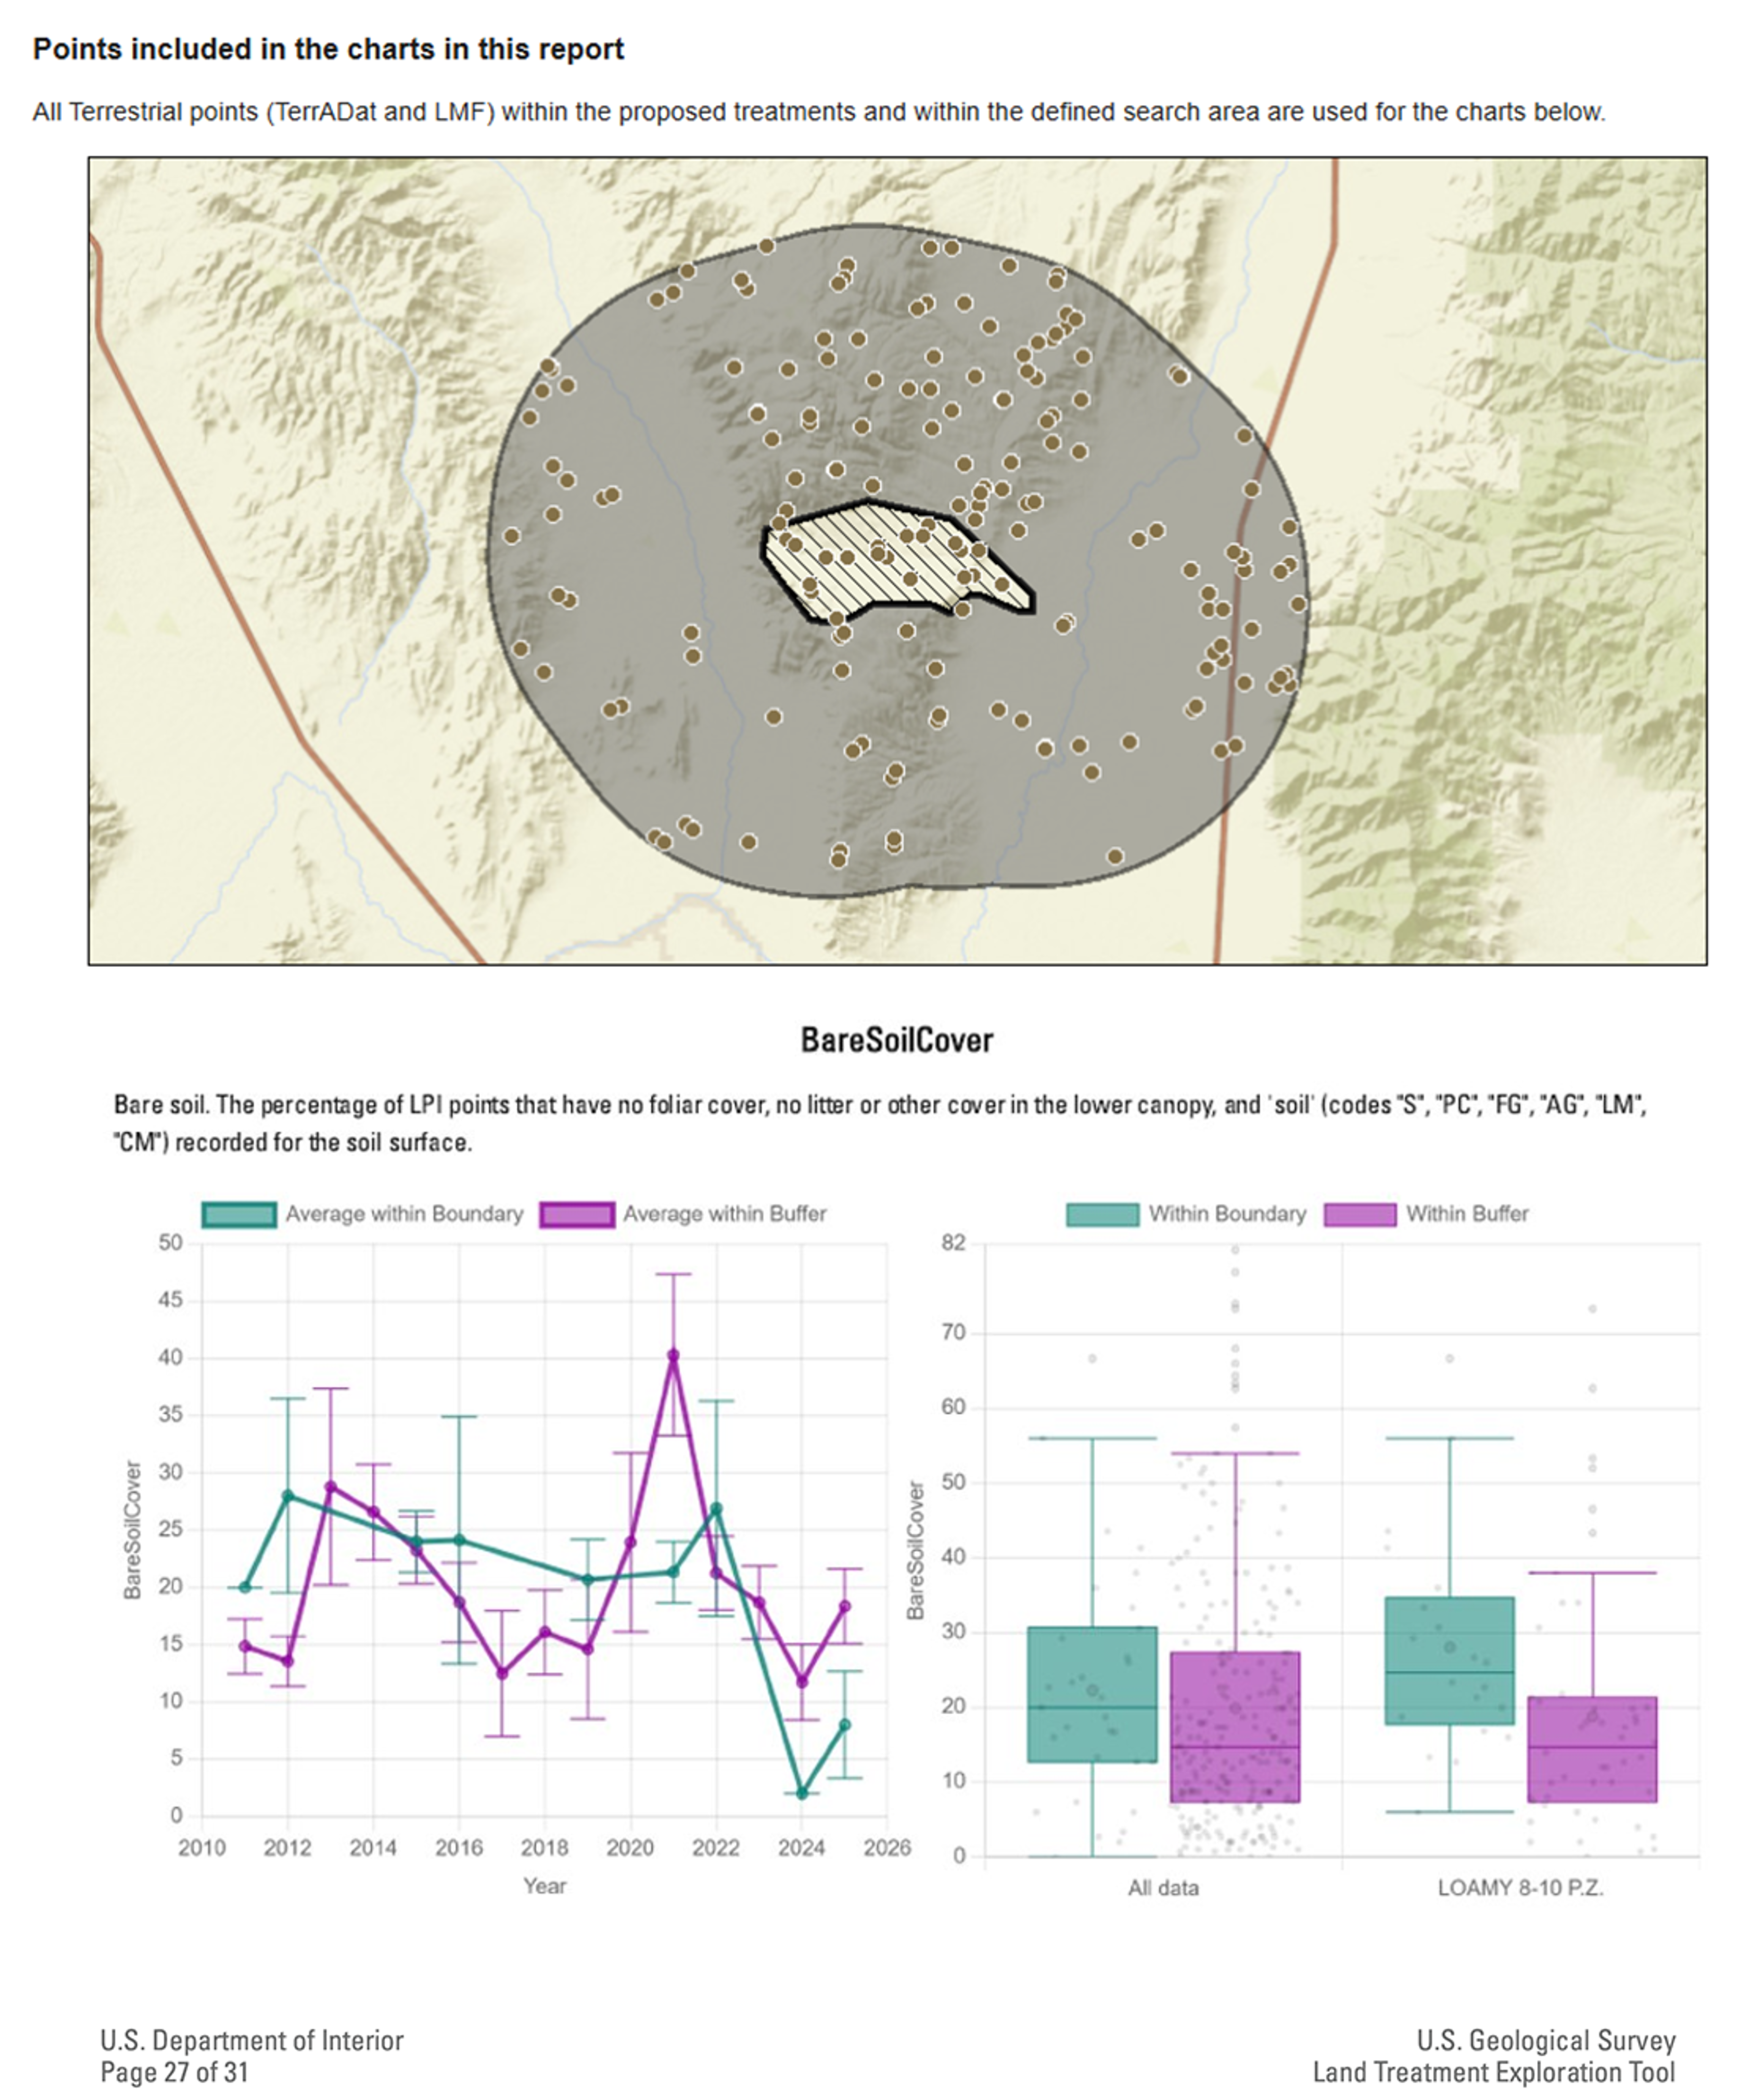
The charts display data from within the user defined boundary (seafoam green in bottom panels, hatched area in top panel), and within a buffered search distance nearby (fuchsia in bottom panels, shaded grey in top panel). The boxplot charts are further displayed by ecological site with the plots sampled on the Loamy 8-10 site description. Charts can be created for any of the relevant data columns in the BLM dataset and included in the Site Characterization Report. The chart creation and interaction function can be found within the Monitoring Tab.
Sources/Usage
Public Domain.