
Alongshore-varying forecasts of barrier island response

Detailed Description
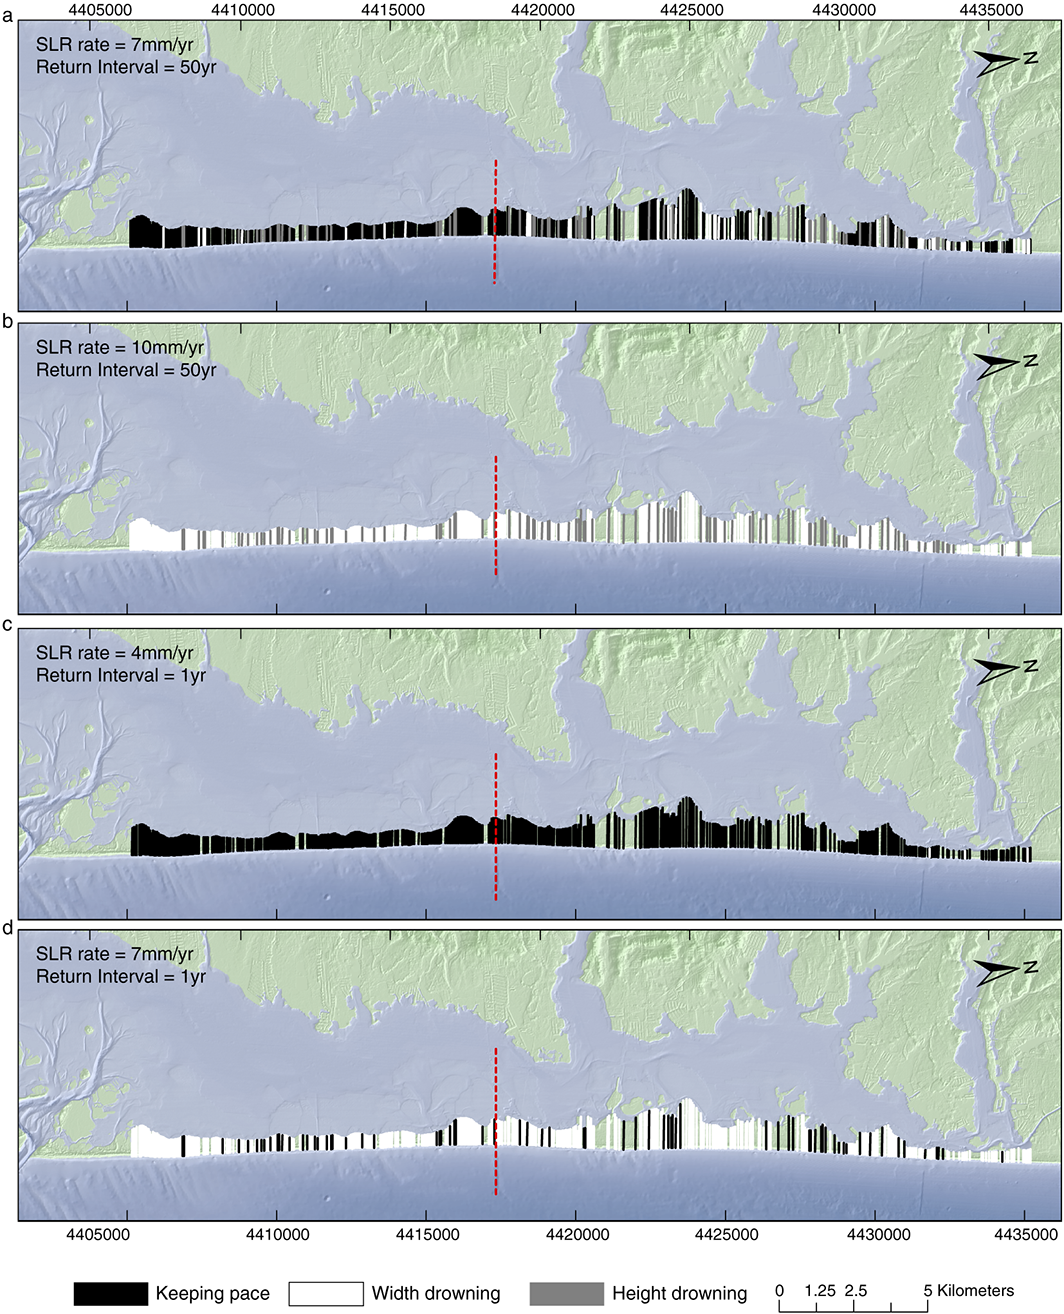
Alongshore-varying forecasts of barrier island response to sea-level rise for storm return intervals of (a and b) 50 years and (c and d) 1 year and for SLR rates of 4 (Figure 4c), 7 (Figures 4a and 4d), and 10 mm/yr (Figure 4b). The dashed red line indicates the (right) developed and (left) undeveloped transition. The lines spanning the barrier indicate location of cross-shore transects; the colors indicate modeled barrier island response: keeping pace = black; height drowning = gray; width drowning = white. No color indicates no data.
Sources/Usage
Public Domain.
Natural and Human-Induced Variability in Barrier-Island Response to Sea Level Rise
Miselis, J. L., & Lorenzo-Trueba, J. (2017). Natural and human-induced variability in barrier-island response to sea level rise. Geophysical Research Letters, 44. https://doi.org/10.1002/2017GL074811