
Amplification of Seismic Waves in Fault Zones
Detailed Description
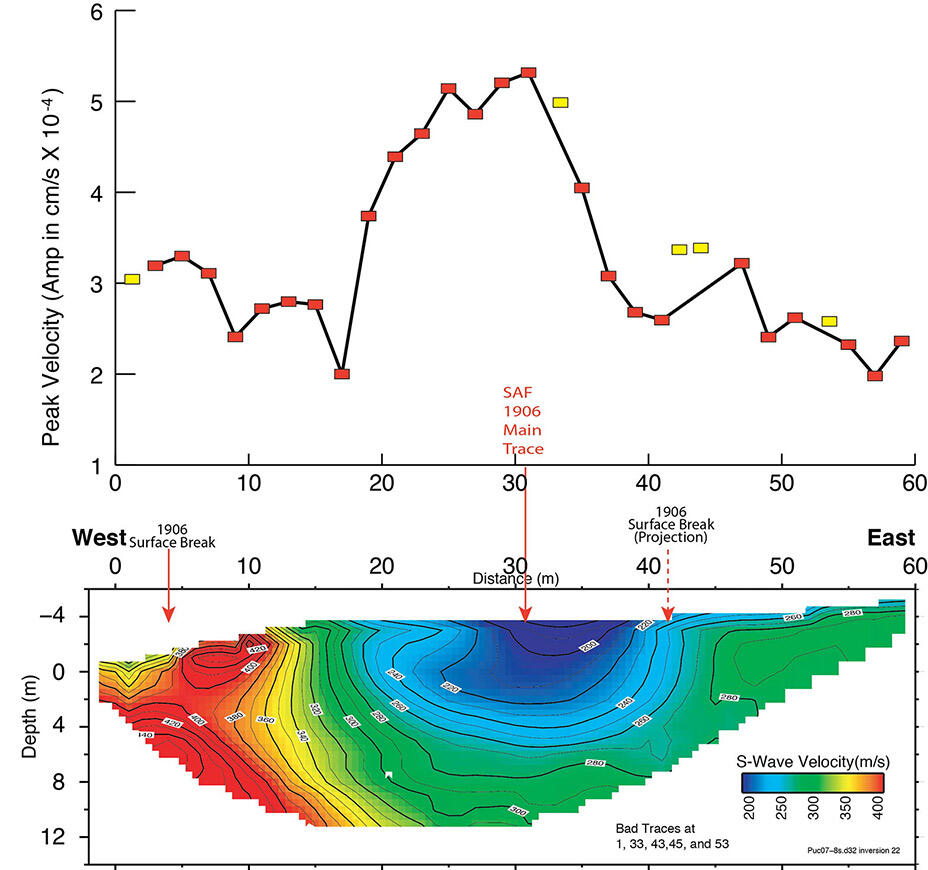
Example of amplification of seismic waves in fault zones.
(a) Plot of peak ground velocity (amplitude) as a function of distance across the San Andreas Fault. Note the high amplitudes centered over the San Andreas Fault.
(b) Cross section of seismic velocities across the San Andreas Fault. The main trace of the San Andreas Fault that ruptured in 1906 is located at about meter 31 of the seismic profile (see red arrow). Two other minor faults are shown at meters 4 and 41. Note the very low seismic velocities of material within the main fault zone relative to the areas to either side. Many other fault zones have shown similar amplification.
Sources/Usage
Public Domain.