



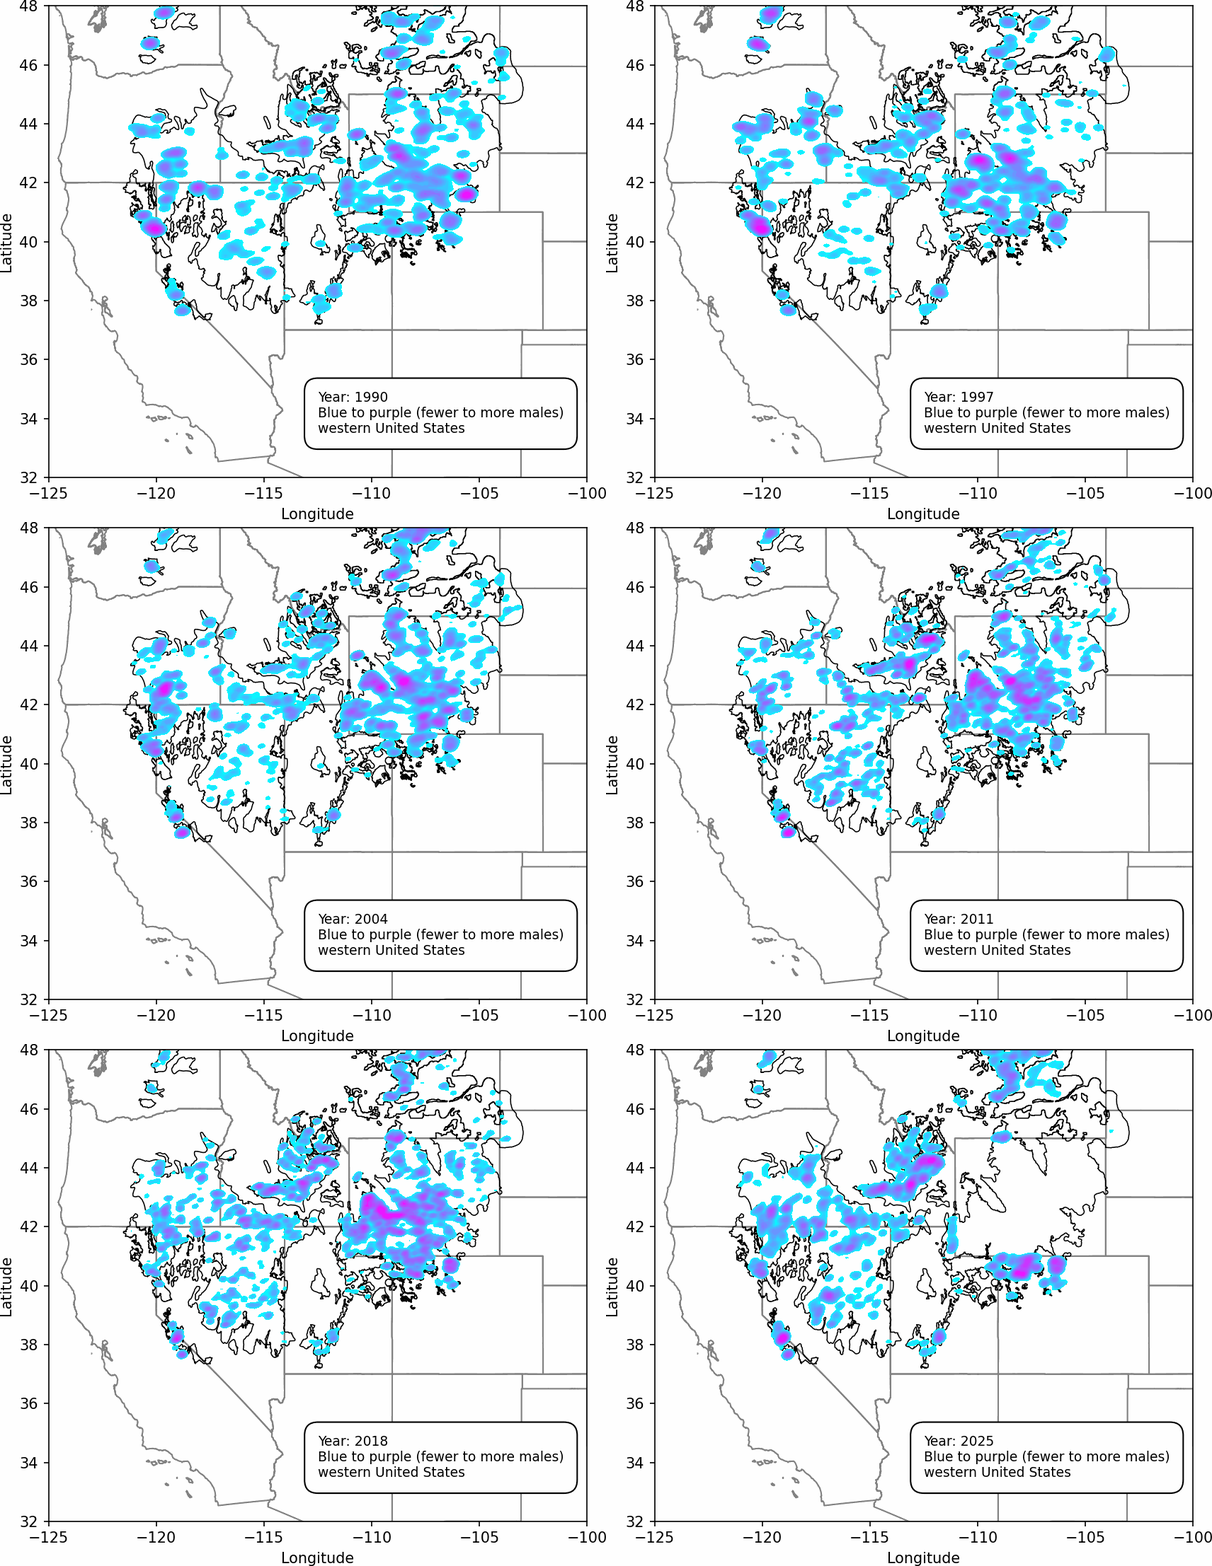
An animated heat map of greater sage-grouse (Centrocercus urophasianus) annual peak male counts from 1990 to 2025
By Fort Collins Science Center
March 2024 (approx.)
Detailed Description
An animated heat map of greater sage-grouse (Centrocercus urophasianus) annual peak male counts from 1990 to 2025 using the standardized sage-grouse lek database. The color ramp uses light blue (fewest number of males counted on leks) to purple (greatest number of males counted on leks), reflecting local minimum and maximum counts of males (O’Donnell and others, 2026, grsg_lekdb: Compiling and standardizing greater sage-grouse lek databases, (version 1.4.0): U.S. Geological Survey software release, https://doi.org/10.5066/P1T8TXJJ).
Sources/Usage
Public Domain.
Related

Data Harmonization for Greater Sage-Grouse Populations
Long-term wildlife monitoring is imperative for understanding population changes that can inform managers. However, working with population data collected by different organizations across multiple jurisdictions and over long time periods can be challenging due to varying data management approaches and organizational priorities. Through this project, we aimed to collaborate with eleven state...
Related
Data Harmonization for Greater Sage-Grouse Populations
Long-term wildlife monitoring is imperative for understanding population changes that can inform managers. However, working with population data collected by different organizations across multiple jurisdictions and over long time periods can be challenging due to varying data management approaches and organizational priorities. Through this project, we aimed to collaborate with eleven state...