
August 2022 Streamflow
Detailed Description
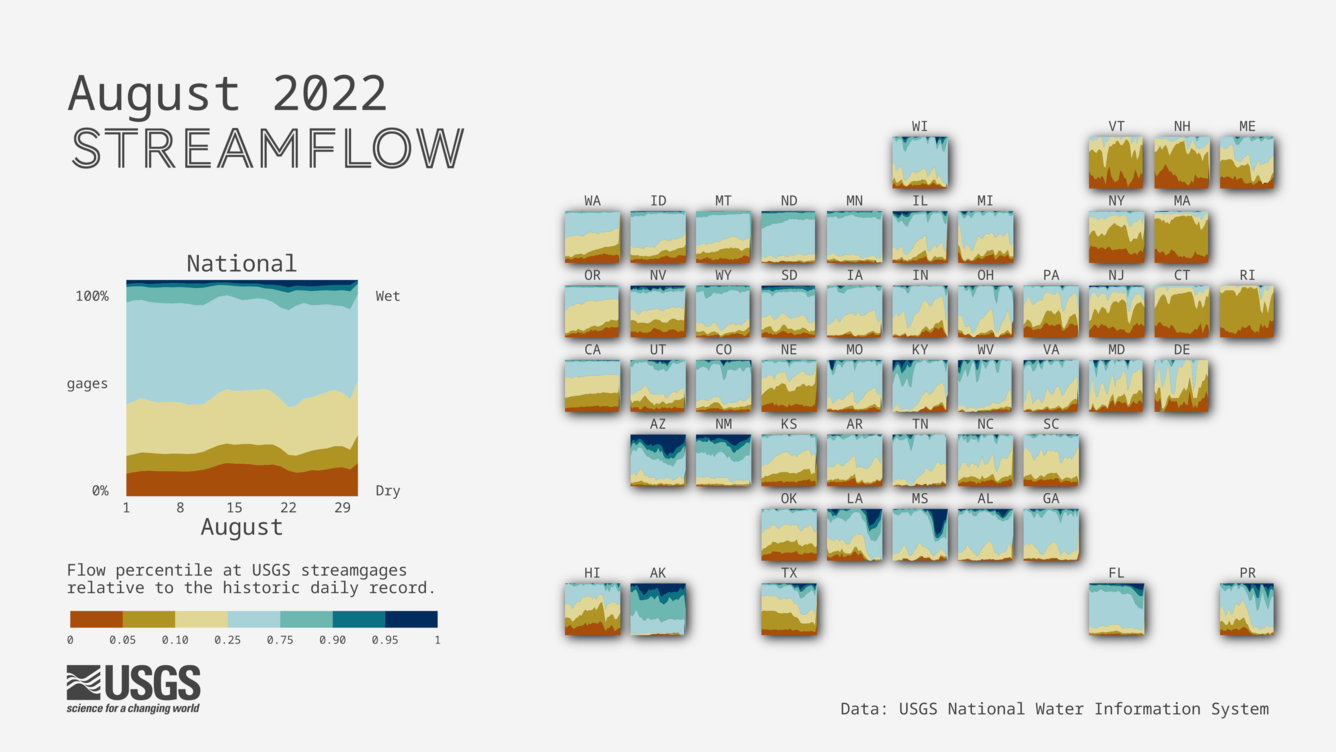
A cartogram map of the US with proportional area charts for each state showing the proportion of streamgages by flow levels, categorized using percentile bins. Streamflow level percentiles are calculated using the historic daily record for each gage, and binned to reflect whether flow conditions are wetter or drier than the historical record. For the month of August, the Northeast states faced very dry conditions. The Northwest states also faced dry conditions, along with much of the Midwest. Arizona and New Mexico, along with Louisiana and Missouri, faced flood levels during this month.
View the previous month's streamflow conditions: July 2022 Streamflow | U.S. Geological Survey (usgs.gov)
Sources/Usage
Public Domain.