
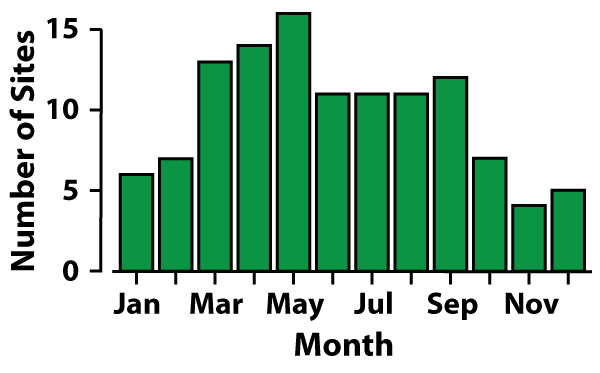
Bar Graph Showing Months of Peak Chlorophyll Concentrations
By Environmental Health Program
2007 (approx.)

Detailed Description
The above bar graph shows the months that peak chlorophyll concentrations occurred in 116 coastal water bodies in the northern temperate zone. The distribution is surprisingly even from March through September, although, peaks occurred throughout the year. The distribution shows no characteristic single seasonal pattern, a large departure from the regular seasonal pattern of plants on land that is tightly tied to the annual climate cycle (The graph is a modified version of figure 4 from Cloern and Jassby, 2008)
Sources/Usage
Public Domain.