
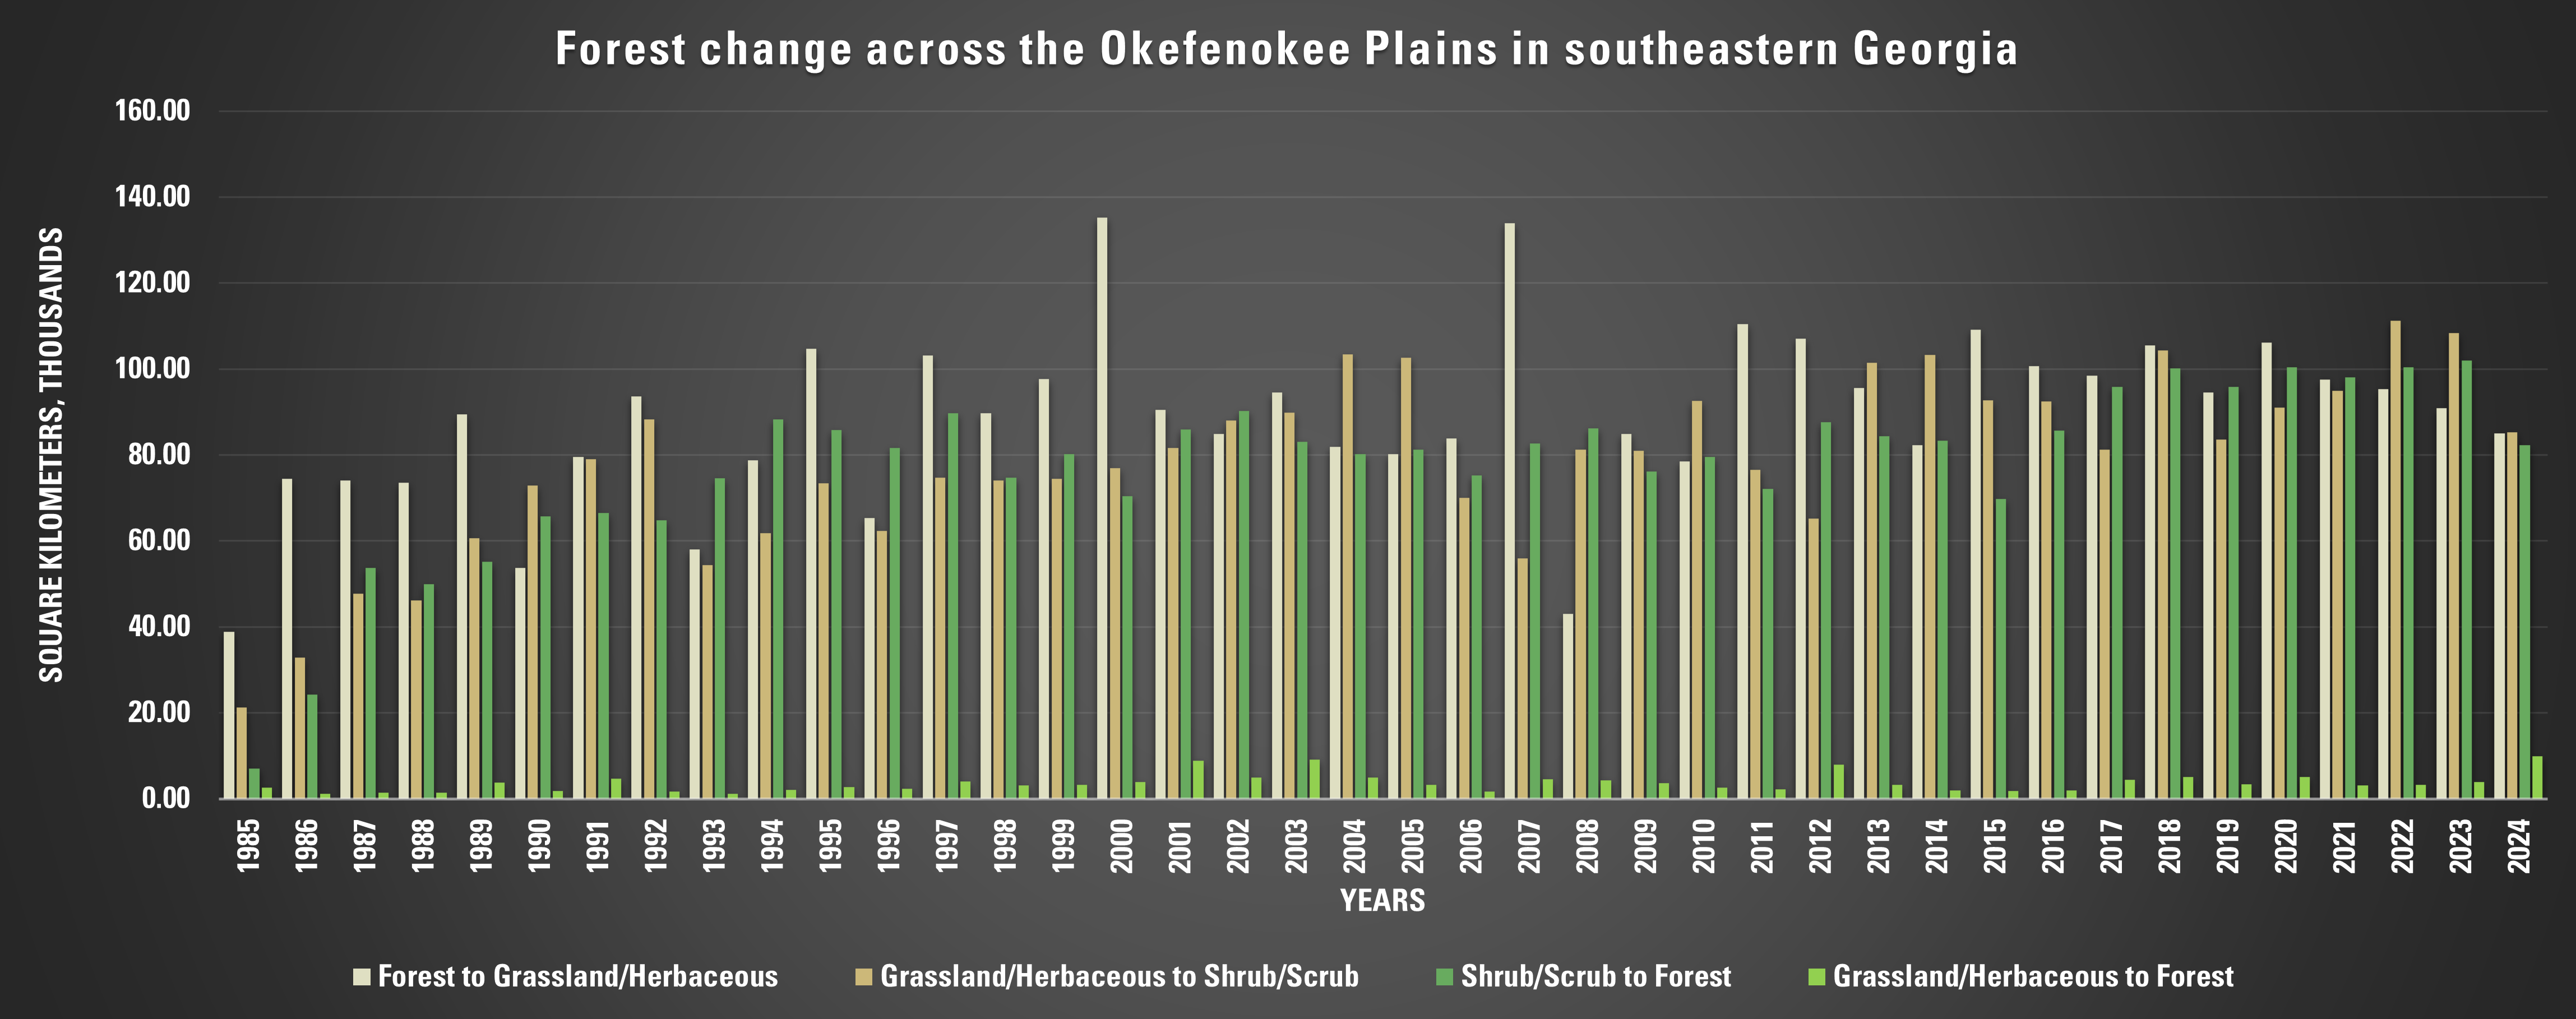
Chart of the amount of forest change across the Okefenokee Plains from 1985-2024
Altered Content -
Annual NLCD uses AI methods to process and produce its product.
Detailed Description
This chart shows the amount of forest change across the Okefenokee Plains for each year from 1985-2024. The change is shown in four categories, transitions from forest cover to herbaceous species like grasses, herbaceous to shrubland, shrubland back to forest, and less typically, herbaceous to forest. The amount is measured by the number of Annual National Land Cover Database (NLCD) pixels that show each change (pixels are 30-meter-by-30-meter areas on the ground, or 98 by 98 feet).
Sources/Usage
Public Domain.